Processing and Analyzing FAST5 files from a minION Run
- Author
Michael Hall
- Date
4/25/2022
FAST5 Files
FAST5 files are raw data produced from a MinION Run. In this tutorial I show two major data processing steps after DNA has been extracted from a model organism. An experiment was done on a Coffee Plant in this case and two fastq files were produced, one failed, the other succeeded. First I would like to determine the quality of the data using Qualimap. Second I would like to run FAST5 files through an R Script pipleine that also assess its quality.
Installation
It is necessary to clone a github repository to do the analysis from my account. First clone it https://github.com/PBGLMichaelHall/FAST5.git.
Data Tree
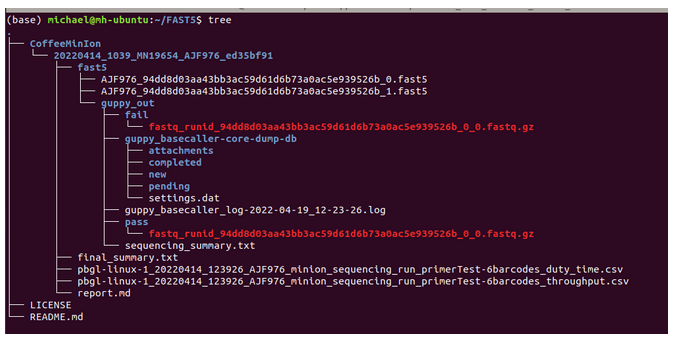
# I attempt to showcase how to run a FASTQ file through a bioinformatics pipleine
# Downstream Analysis using Basecalling with Guppy
# Invoke guppy_basecaller
# Provide all relevant flags and input parameters
guppy_basecaller --compress_fastq -i fast5/guppy_out/ -f FLO-FLG001 -k SQK-LSK109 --cpu_threads_per_caller 4 --num_callers 1
guppy_basecaller --compress_fastq -i fast5/ -s fast5/guppy_out/ --flowcell FLO-FLG001 --kit SQK-LSK109 --cpu_threads_per_caller 4 --num_callers 1
--compress_fastq Compress fastq output files with gzip.
-i Path to input fast5 files.
-s Path to save fastq files.
--flowcell Flowcell to find a configuration for
--kit Kit to find a configuration for
--cpu_threads_per_caller Number of CPU worker threads per
--num_callers Number of parallel basecallers to create.
# Clone github graphmap repository and make modules
git clone https://github.com/isovic/graphmap.git
cd graphmap
make modules
make
# Specify System file path to graphmap executable program
~/graphmap/bin/Linux-x64/
# Locate fast5 and reference genome fasta files and invoke graphmap program to align
../../../graphmap/bin/Linux-x64/graphmap align -r CoffeeArabica_Cara/ncbi_dataset/data/GCF_003713225.1/Coffee.fna
-t 4 -d fast5/guppy_out/pass/fastq_runid_94dd8d03aa43bb3ac59d61d6b73a0ac5e939526b_0_0.fastq.gz
-o map_to_ref/nanopore.graphmap.sam > map_to_ref/nanopore.graphmap.sam.log 2>&1
-r reference genonme
-t Threads
-d Directory of FastQ file from FAST5 raw data
-o output directory to file ending with .sam
> create log of run
# Invoke samtools stats on sam file
samtools stats -d -@ 4 nanopore.graphmap.sam > nanopore.graphmap.sam.stats
# Inpect first 40 lines of header
head -n 40 nanopore.graphmap.sam.stats
# Invoke samtools view and condition on samtools sort to make a sorted bam file
samtools view -@ 4 -bS nanopore.graphmap.sam | samtools sort - -@ 4
-o nanopore.graphmap.sorted.bam
# Create a Qualimap Environment
conda create --name Qualimap
conda activate Qualimap
conda install -c bioconda qualimap
# Invoke qualimap on sorted bam file an HTML report should be generated automatically
qualimap bamqc -bam nanopore.graphmap.sorted.bam -nw 5000 -nt 4 -outdir nanopore.graphmap
# Index Reference Genome
bwa index Coffee.fna
# make a Directory for vcf file
mkdir vcfplots
# Invoke samtools pileup to align indexed fasta to sorted bam
samtools mpileup -g -f CoffeeArabica_Cara/ncbi_dataset/data/GCF_003713225.1/Coffee.fna map_to_ref/nanopore.graphmap.sorted.bam
| bcftools call -mv -o vcfplots/all.vcf
# Filter for SNPs type and Biallelic sites only
bcftools view -m2 -M2 -v snps -o BIALLELIC~ONLY.vcf all.vcf
# How many variants were called
bcftools view BIALLELIC~ONLY.vcf | wc -l
1468
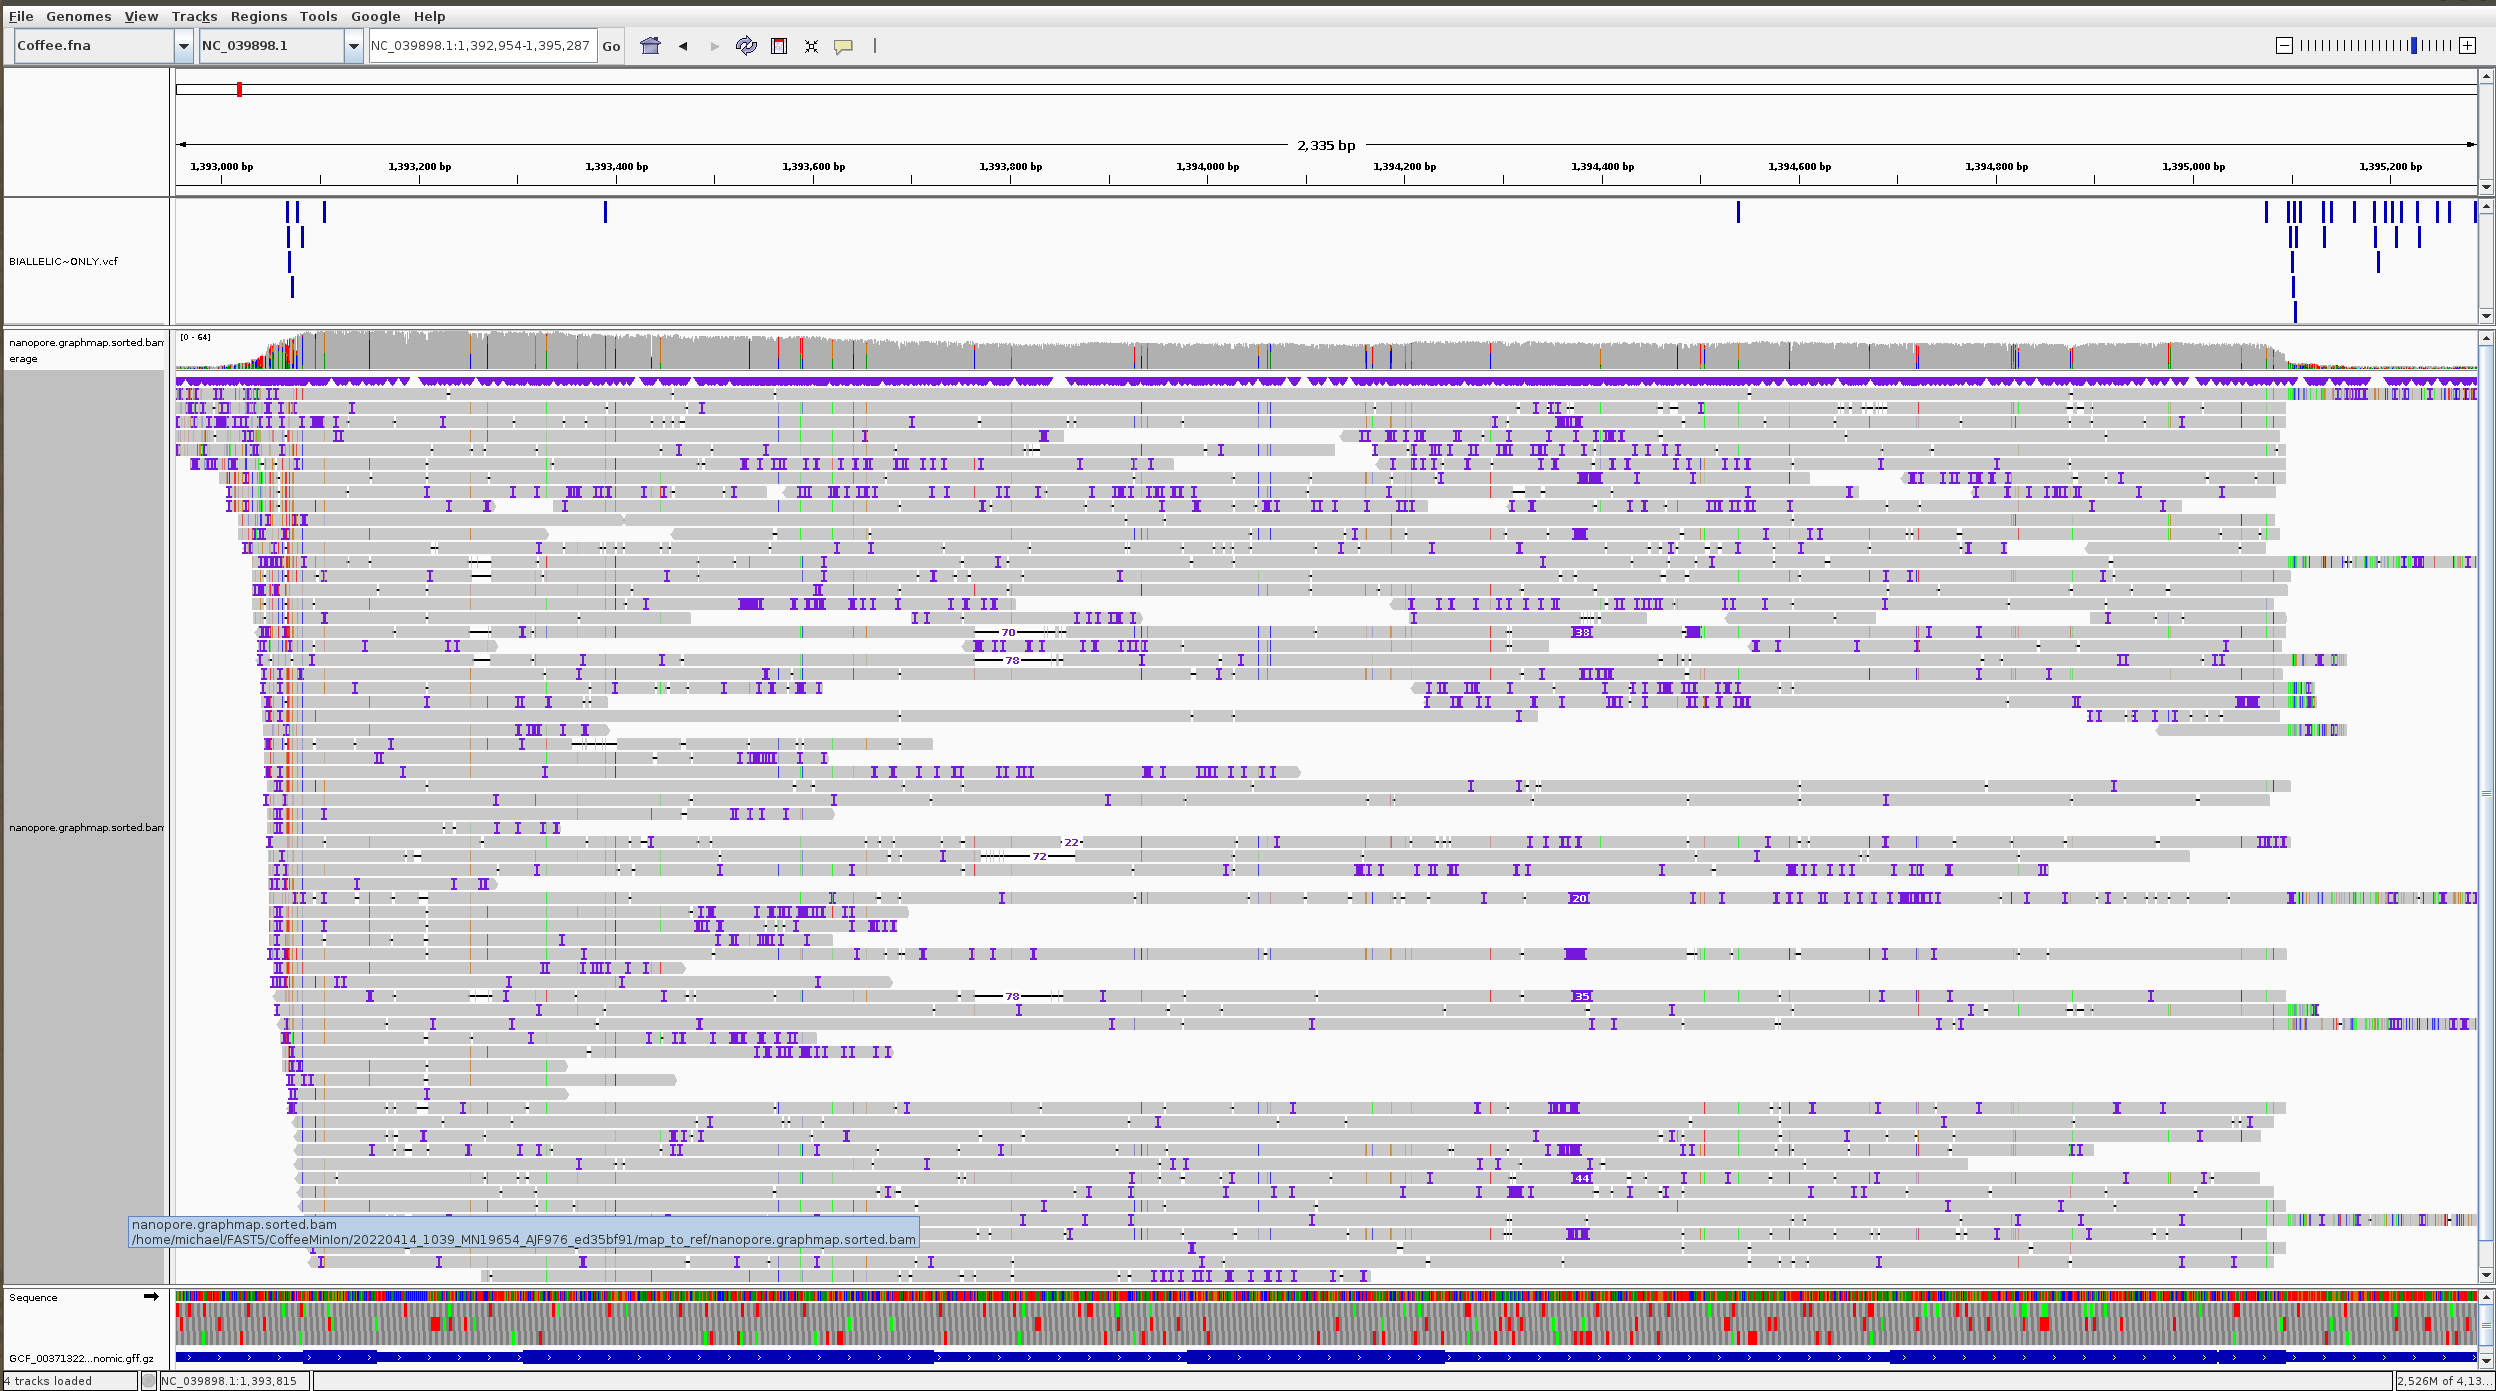
# run IGV program on Reference Genome, Sorted Bam, and VCF
~/IGV_Linux_2.11.9
bash igv.sh
Load Coffee Arabica Genome
# Use Rsubread package to find genes with mapped read
setwd("/home/michael/FAST5/CoffeeMinIon/20220414_1039_MN19654_AJF976_ed35bf91/map_to_ref")
# Sorted BAM file
# gene annotation file
FeatureCounts<-
Rsubread::featureCounts(files = "nanopore.graphmap.sorted.bam",
annot.ext ="../GCF_003713225.1_Cara_1.0_genomic.gff.gz",isGTFAnnotationFile = TRUE,GTF.featureType = "gene", GTF.attrType = "ID")
annotation <- FeatureCounts$annotation
stat <- FeatureCounts$stat
counts <- FeatureCounts$counts
ASC <- cbind(annotation,counts)
threshold <- 0
ASC <- ASC[(apply(counts,1,min)) > threshold,]
print(ASC)
GeneID Chr Start End Strand Length nanopore.graphmap.sorted.bam
gene-LOC113688632 gene-LOC113688632 NC_039898.1 1392954 1395287 + 2334 81
gene-LOC113697586 gene-LOC113697586 NC_039899.1 884021 886305 + 2285 118
gene-LOC113697595 gene-LOC113697595 NC_039899.1 893020 895356 + 2337 148
gene-LOC113731239 gene-LOC113731239 NC_039901.1 14523710 14529861 - 6152 1
gene-LOC113734903 gene-LOC113734903 NC_039902.1 26262544 26264446 + 1903 1
gene-LOC113697766 gene-LOC113697766 NC_039910.1 22728667 22733865 + 5199 1
gene-LOC113708575 gene-LOC113708575 NC_039914.1 2245618 2250386 - 4769 1
gene-LOC113708187 gene-LOC113708187 NC_039914.1 7384813 7386075 - 1263 3
gene-LOC113707907 gene-LOC113707907 NC_039914.1 7430405 7432582 - 2178 367
gene-LOC113708510 gene-LOC113708510 NC_039914.1 7473077 7475443 - 2367 122
gene-LOC113709599 gene-LOC113709599 NC_039915.1 6555704 6558053 - 2350 5
gene-LOC113710584 gene-LOC113710584 NC_039915.1 6598426 6623704 - 25279 1
gene-LOC113710465 gene-LOC113710465 NC_039915.1 6674915 6677084 - 2170 114
gene-LOC113710464 gene-LOC113710464 NC_039915.1 6714444 6716737 - 2294 90
gene-CoarCp011 gene-CoarCp011 NC_008535.1 16850 21025 - 4176 1
# Look at IGV For the first entry printed ASC object
GeneID: gene-LOC113688632
Chromosome: NC_039898.1
Start: 1392954
End: 1395287
Mapped Reads: 81
We want to make a GRanges object that provides variant calls in CODING regions/locations only

setwd("/home/michael/FAST5/CoffeeMinIon/20220414_1039_MN19654_AJF976_ed35bf91")

library(vcfR)
library(VariantAnnotation)
library(GenomicFeatures)

vcf <- readVcf(file = "vcfplots/BIALLELIC~ONLY.vcf")

rd <- rowRanges(vcf)

# convert annotations to TxDb object
GFFTXB<-makeTxDbFromGFF(file="GCF_003713225.1_Cara_1.0_genomic.gff.gz")


Locate Variants
loc <- locateVariants(rd, GFFTXB, CodingVariants())

How many variants were called in coding locations
length(loc)
38 ranges which means 38 total variants were located wihin a coding region with a particular geneID
#Inspect the head
head(loc,10)

GRanges object with 10 ranges and 9 metadata columns:
seqnames                               ranges strand | LOCATION  LOCSTART    LOCEND   QUERYID        TXID
Rle>                               <IRanges>  <Rle> | <factor> <integer> <integer> <integer> <character>
NC_039898.1:1393106_A/G NC_039898.1   1393106      + |   coding        23        23        23         186
NC_039898.1:1393391_T/A NC_039898.1   1393391      + |   coding       160       160        24         186
NC_039898.1:1395076_G/A NC_039898.1   1395076      + |   coding      1134      1134        26         186
NC_039899.1:893176_A/G NC_039899.1    893176      + |   coding        23        23       288        3946
NC_039899.1:893660_T/C NC_039899.1    893660      + |   coding       360       360       289        3946
NC_039899.1:894131_G/A NC_039899.1    894131      + |   coding       574       574       293        3946
NC_039899.1:894232_C/G NC_039899.1    894232      + |   coding       675       675       294        3946
NC_039899.1:894271_G/A NC_039899.1    894271      + |   coding       714       714       295        3946
NC_039901.1:14526465_T/A NC_039901.1  14526465      - |   coding      1144      1144       369       20947
NC_039901.1:14526465_T/A NC_039901.1  14526465      - |   coding      1144      1144       369       20948

CDSID       GENEID       PRECEDEID        FOLLOWID
IntegerList>     <character> <CharacterList> <CharacterList>
NC_039898.1:1393106_A/G                      308 LOC113688632
NC_039898.1:1393391_T/A                      309 LOC113688632
NC_039898.1:1395076_G/A                      312 LOC113688632
NC_039899.1:893176_A/G                    14627 LOC113697595
NC_039899.1:893660_T/C                    14628 LOC113697595
NC_039899.1:894131_G/A                    14629 LOC113697595
NC_039899.1:894232_C/G                    14629 LOC113697595
NC_039899.1:894271_G/A                    14629 LOC113697595
NC_039901.1:14526465_T/A 100255,100256,100257,... LOC113731239
NC_039901.1:14526465_T/A 100255,100256,100257,... LOC113731239

So the head shows there are three variants called on the LOC113688632 gene
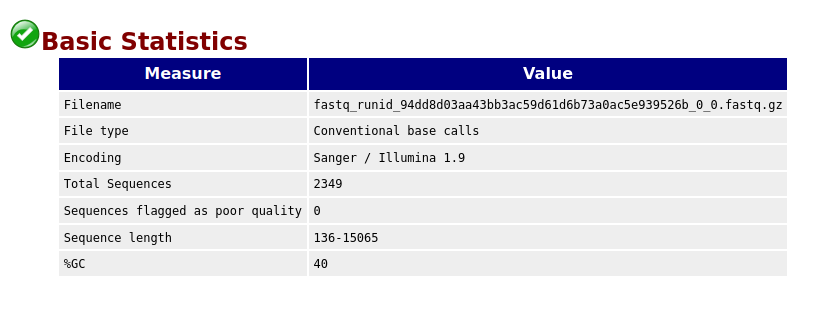
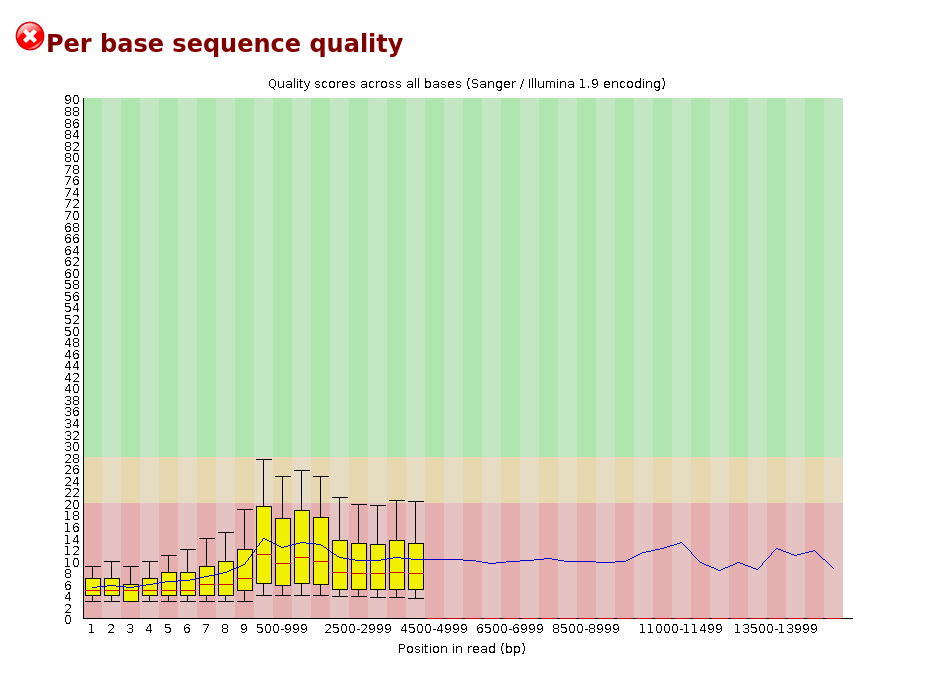
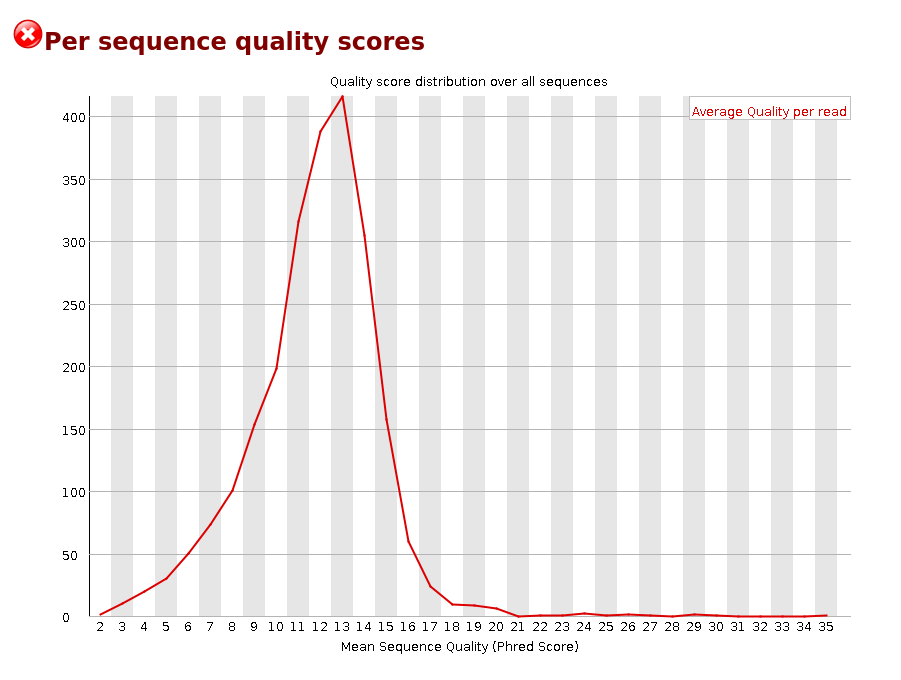
Failed Minion Run QC Report
setwd("~/FAST5/CoffeeMinIon/20220414_1039_MN19654_AJF976_ed35bf91/fast5/guppy_out")
library(fastqcr)
fastqc_install()
fastqc(fq.dir = "/home/michael/FAST5/CoffeeMinIon/20220414_1039_MN19654_AJF976_ed35bf91/fast5/guppy_out/fail",threads = 4)
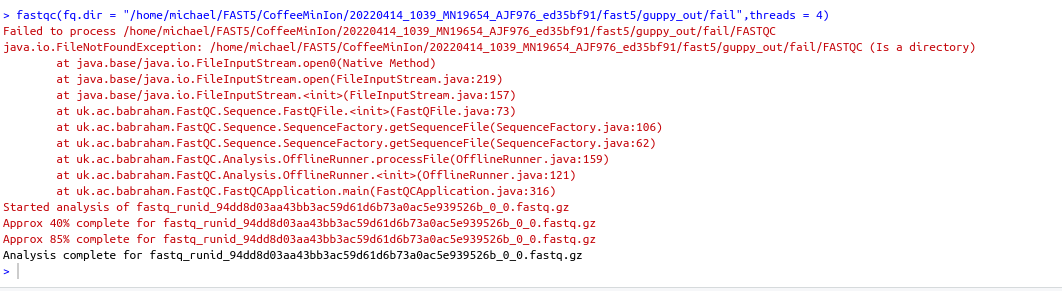
FASTQC Directory and HTML OUTPUT
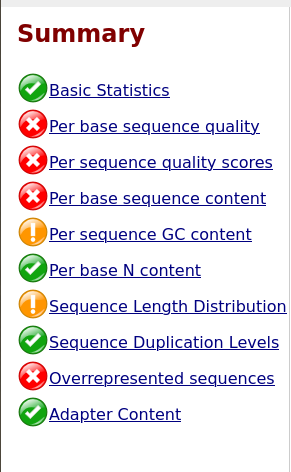
Summary
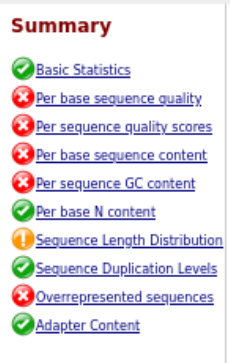
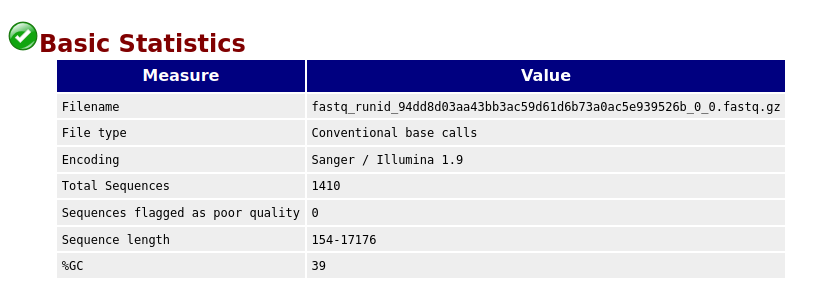
Basic Statistics
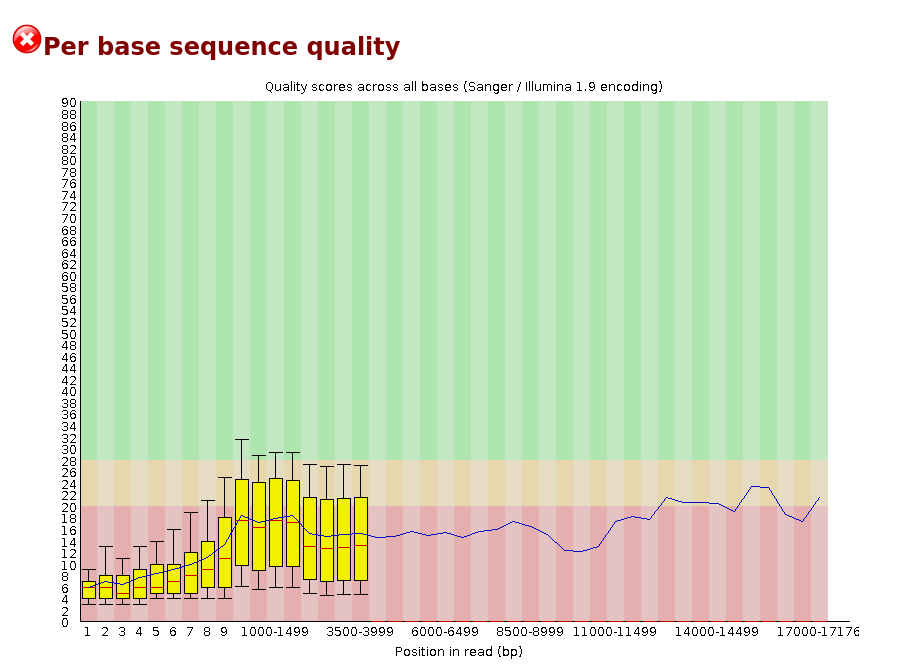
Per base sequence quality
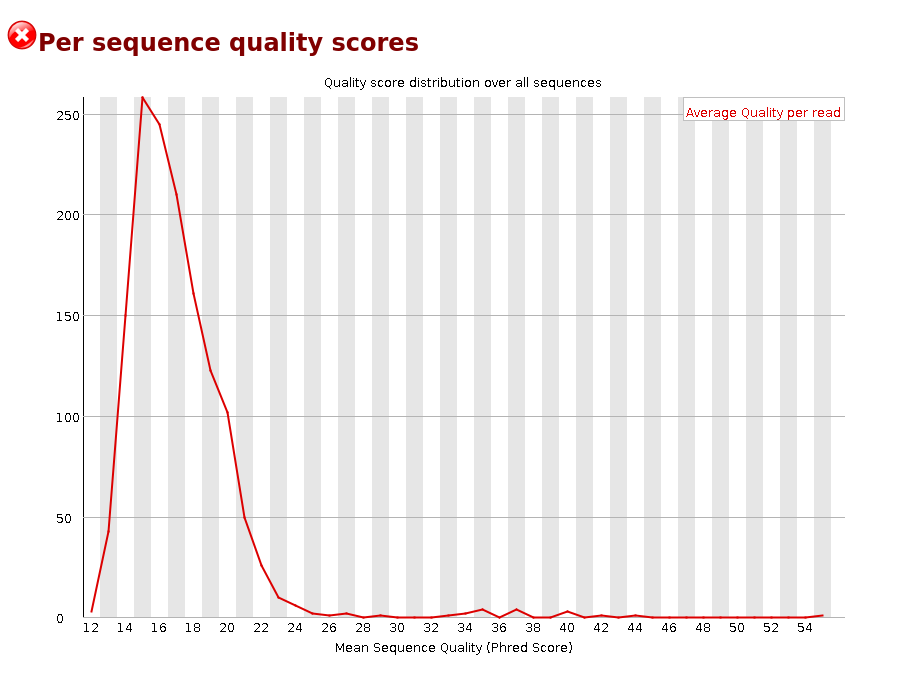
Per sequence quality scores
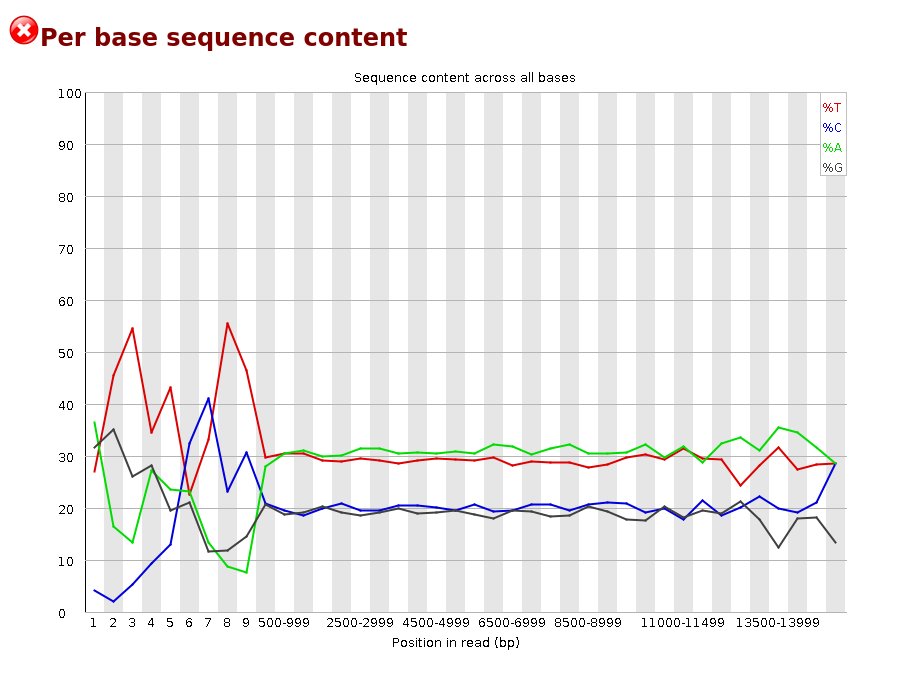
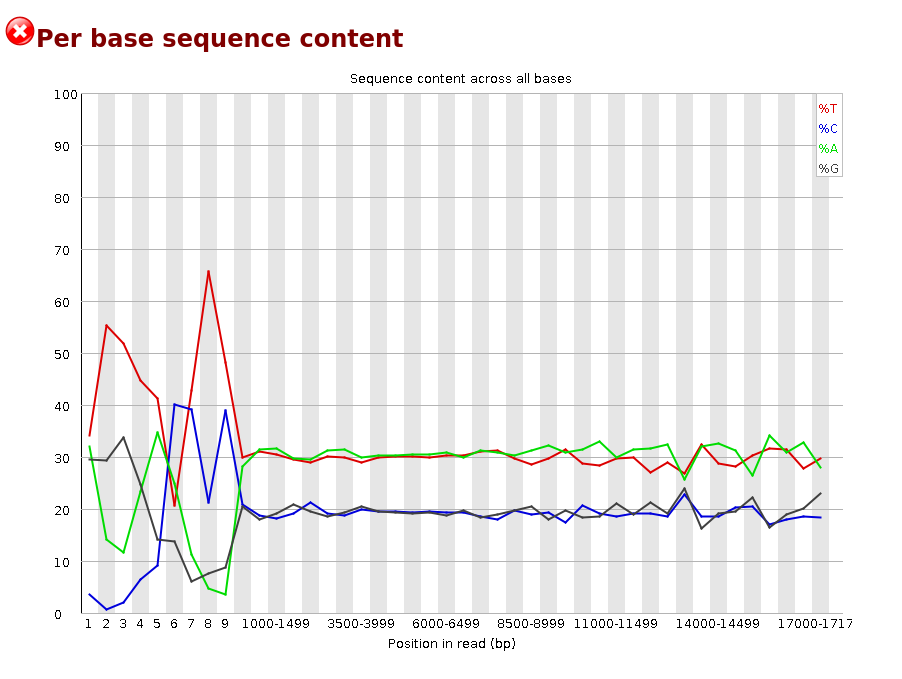
Per base sequence content
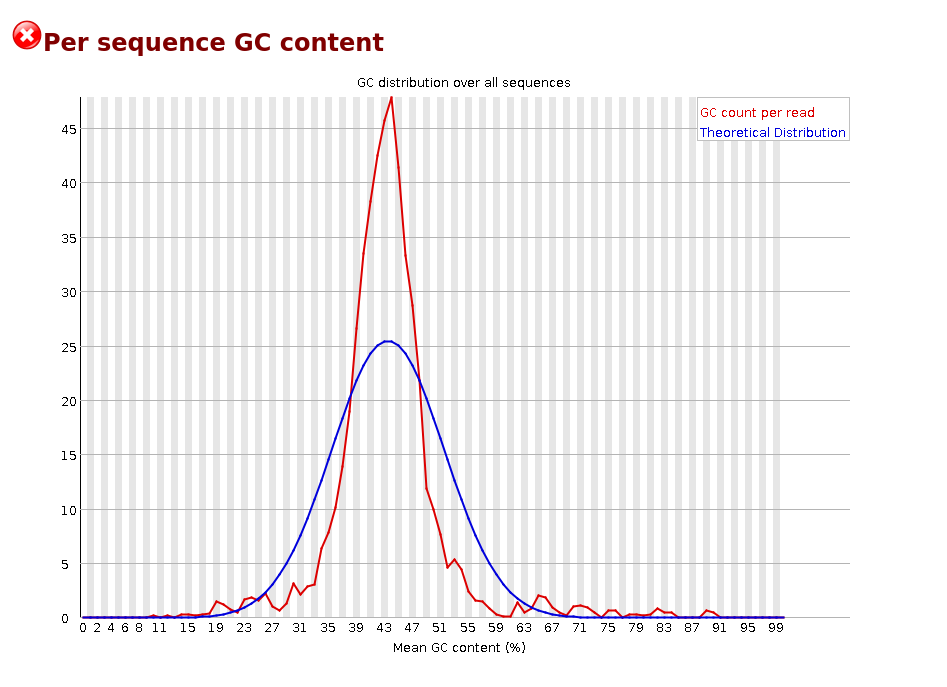
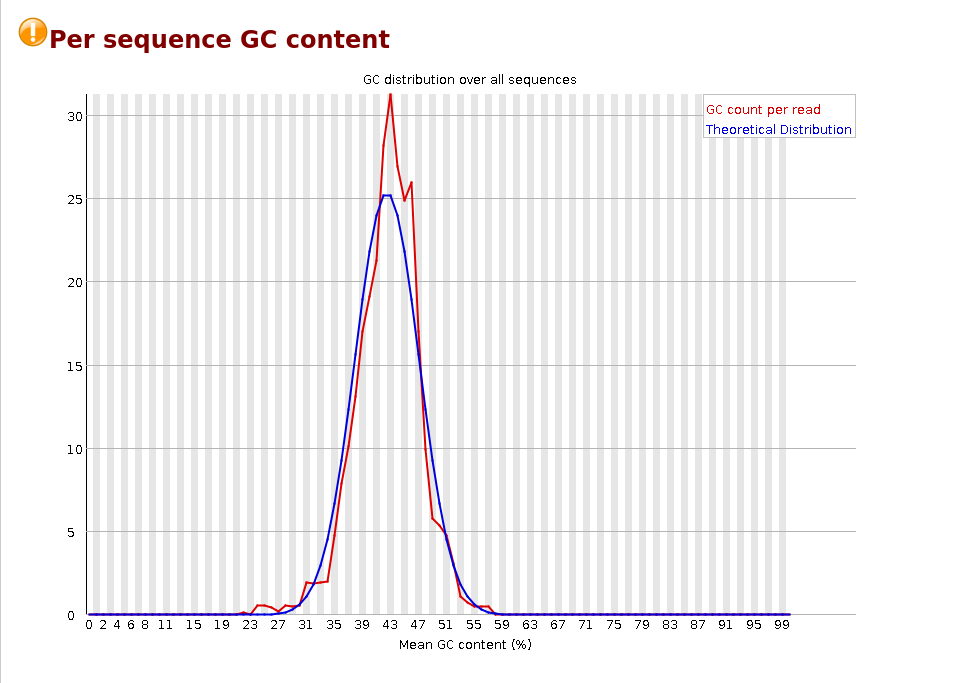
Per sequence GC content
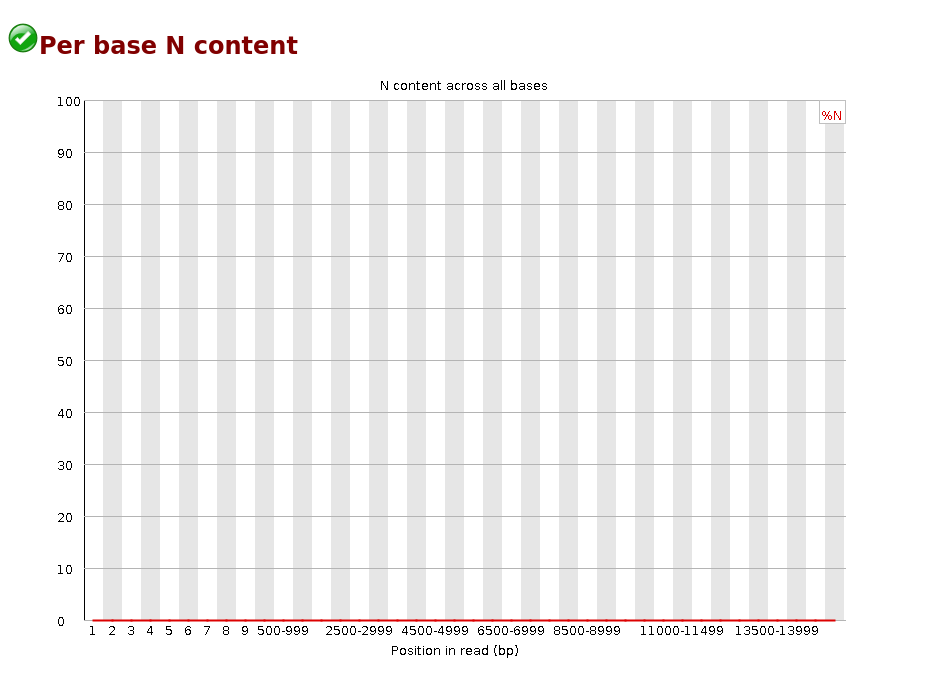
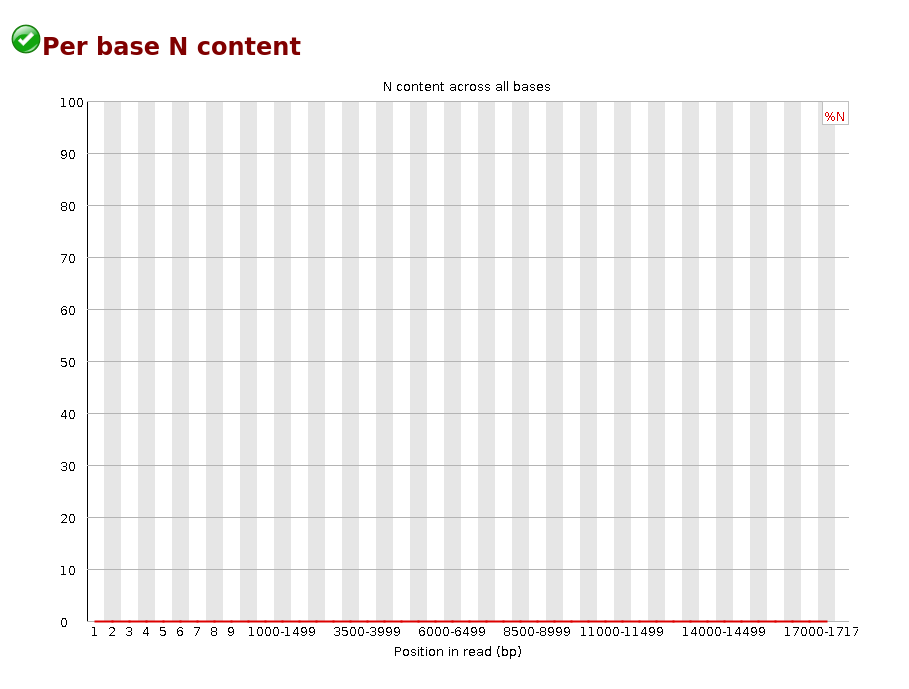
Per base N content
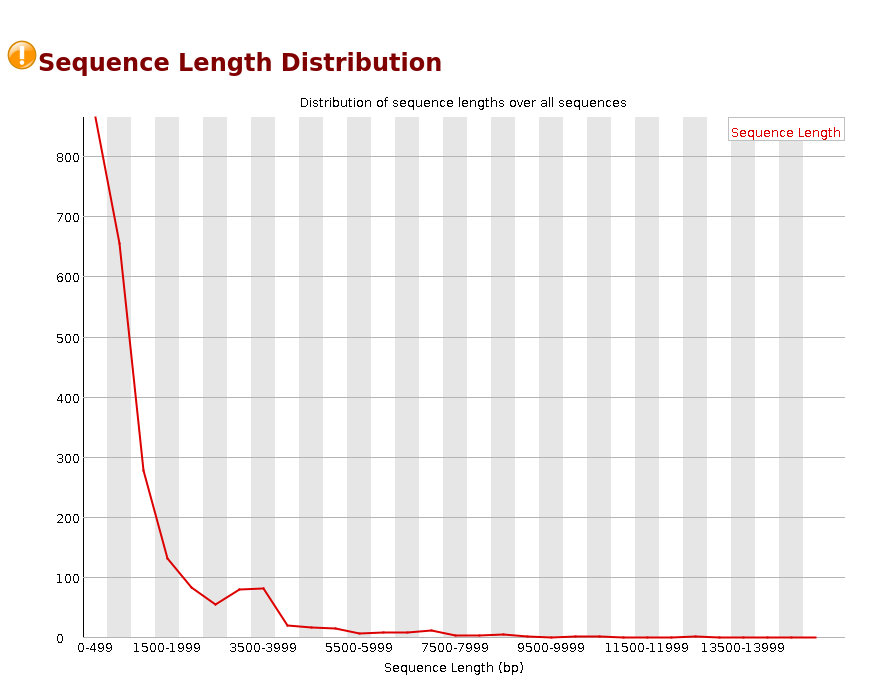
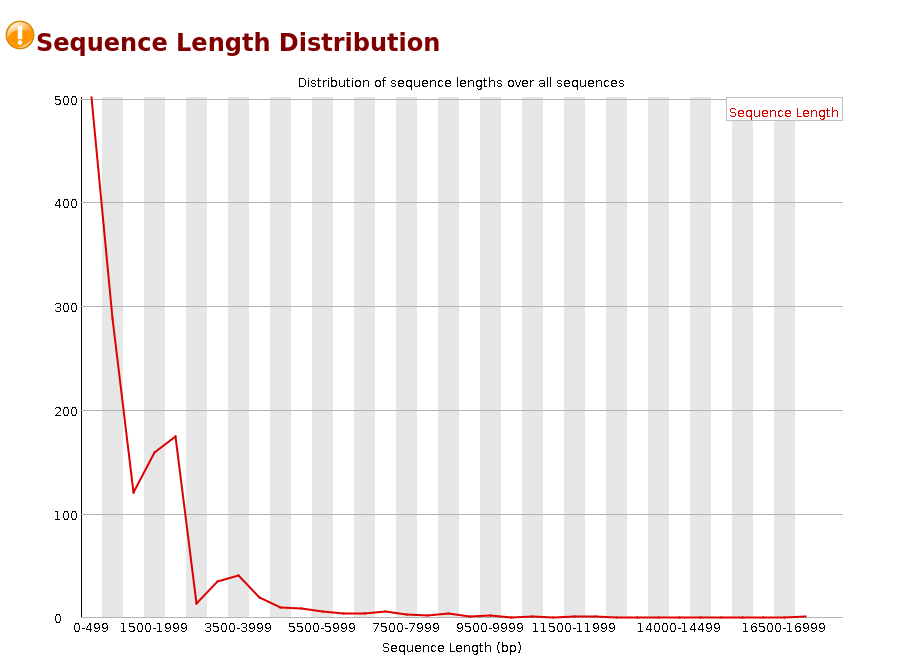
Sequence Length Distribution
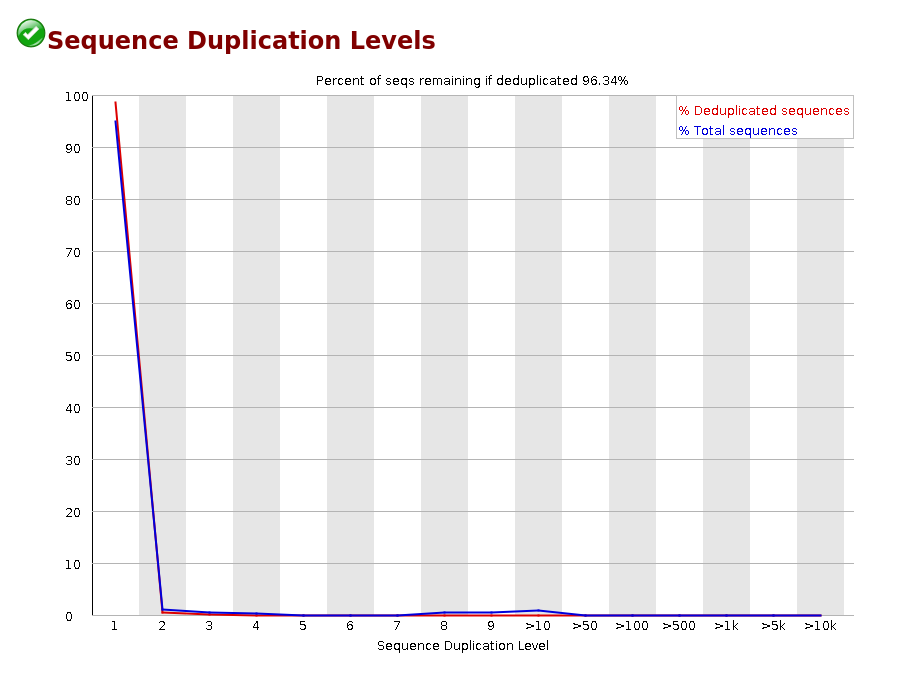
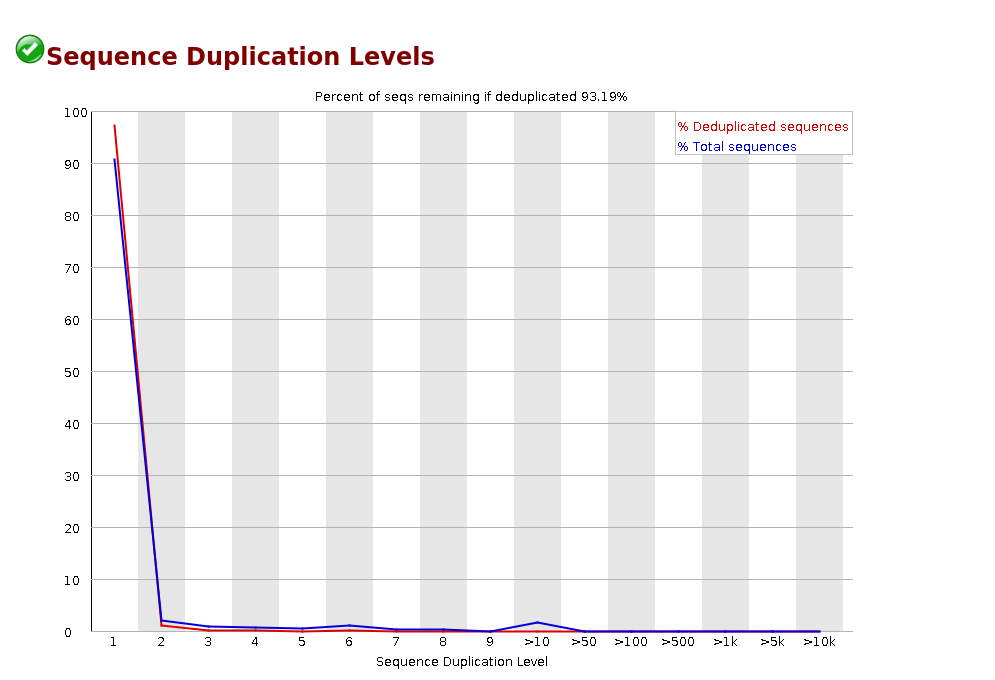
Sequence Duplication Levels
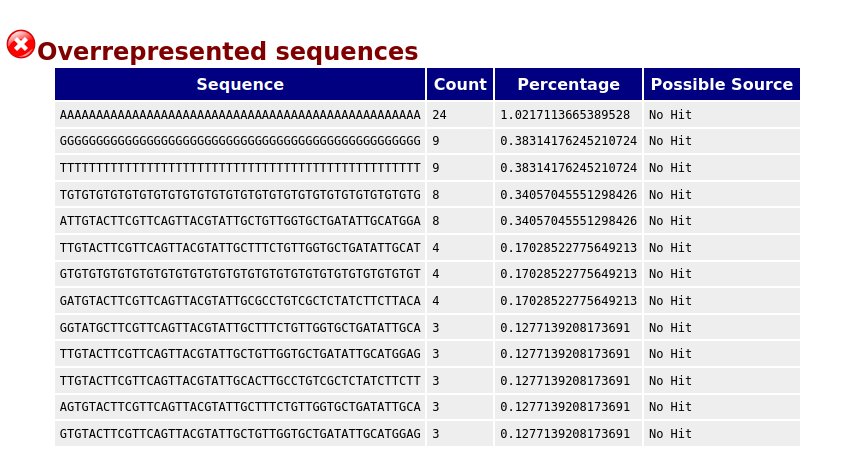
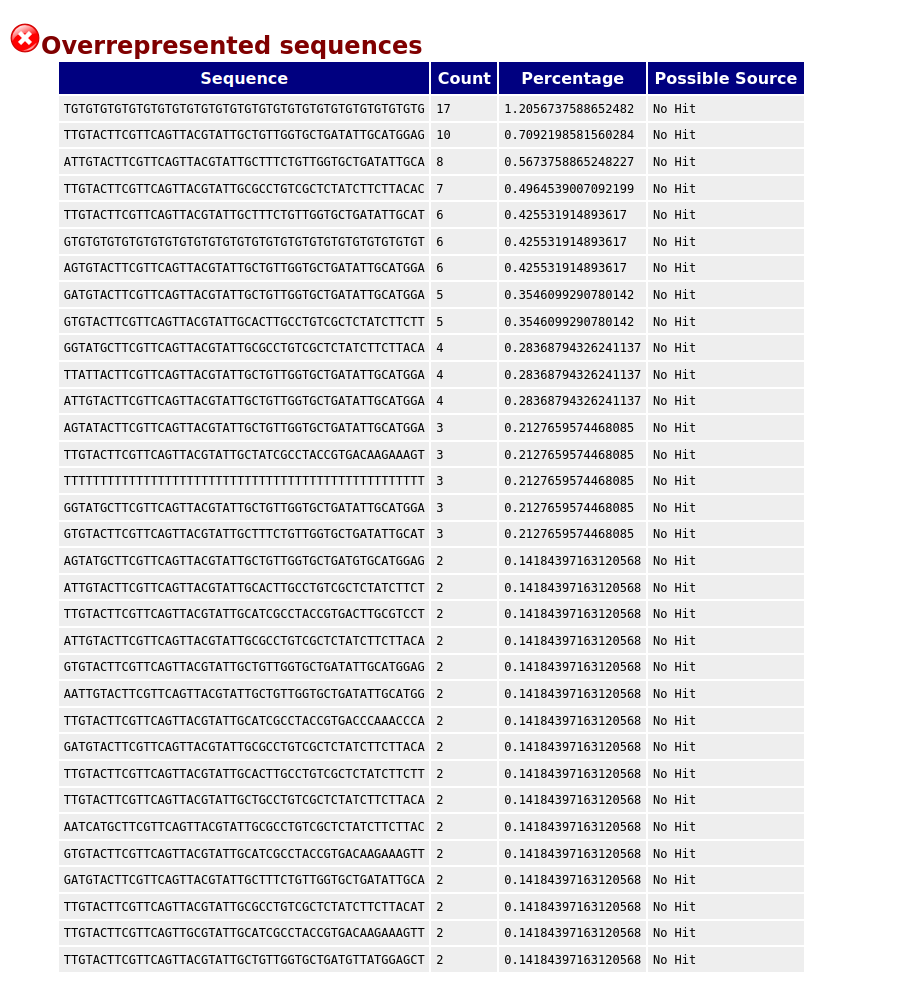
Overrepresented sequences
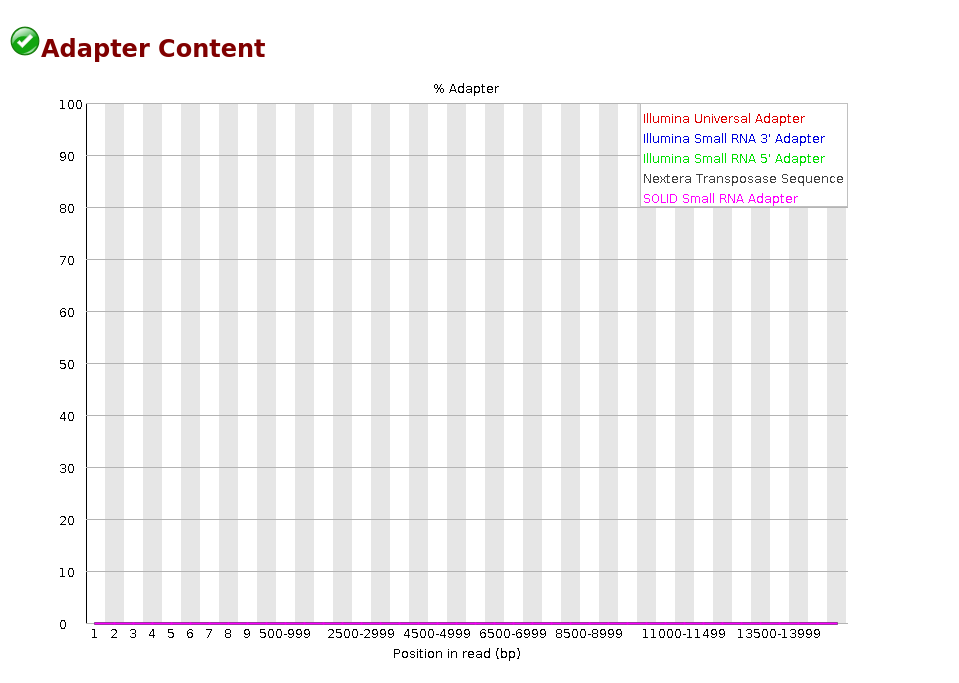
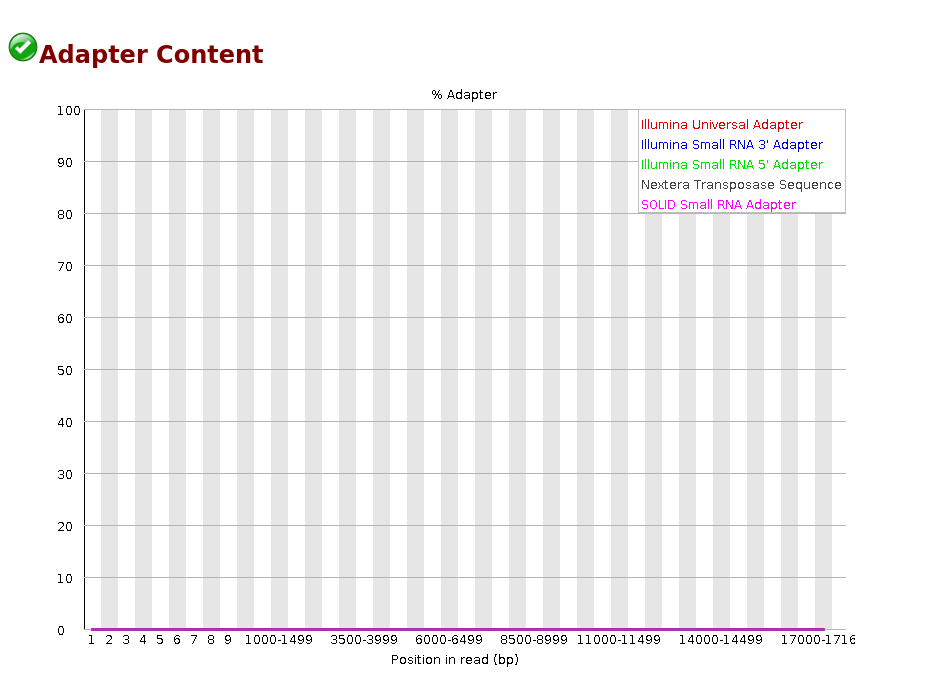
Adpater Content
===============================
Successful Minion Run QC Report
# Set the working directory
setwd("~/FAST5/CoffeeMinIon/20220414_1039_MN19654_AJF976_ed35bf91/fast5/guppy_out")
# Confirm you have fastqcr loaded in your namespace and attached
library(fastqcr)
# If not install it
fastqc_install()
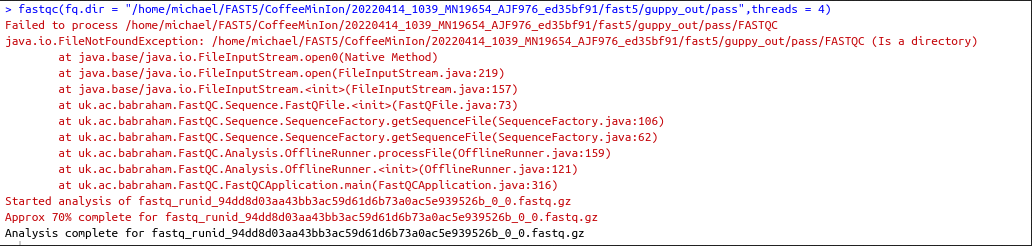
# Call the fastqc function from the package provided passed fastq directory as input argument and specify thread count
fastqc(fq.dir = "/home/michael/FAST5/CoffeeMinIon/20220414_1039_MN19654_AJF976_ed35bf91/fast5/guppy_out/pass",threads = 4)
FASTQC Directory and HTML OUTPUT
Summary
Basic Statistics
Per base sequence quality
Per sequence quality scores
Per base sequence content
Per sequence GC content
Per base N content
Sequence Length Distribution
Sequence Duplication Levels
Overrepresented sequences
Adpater Content
==========
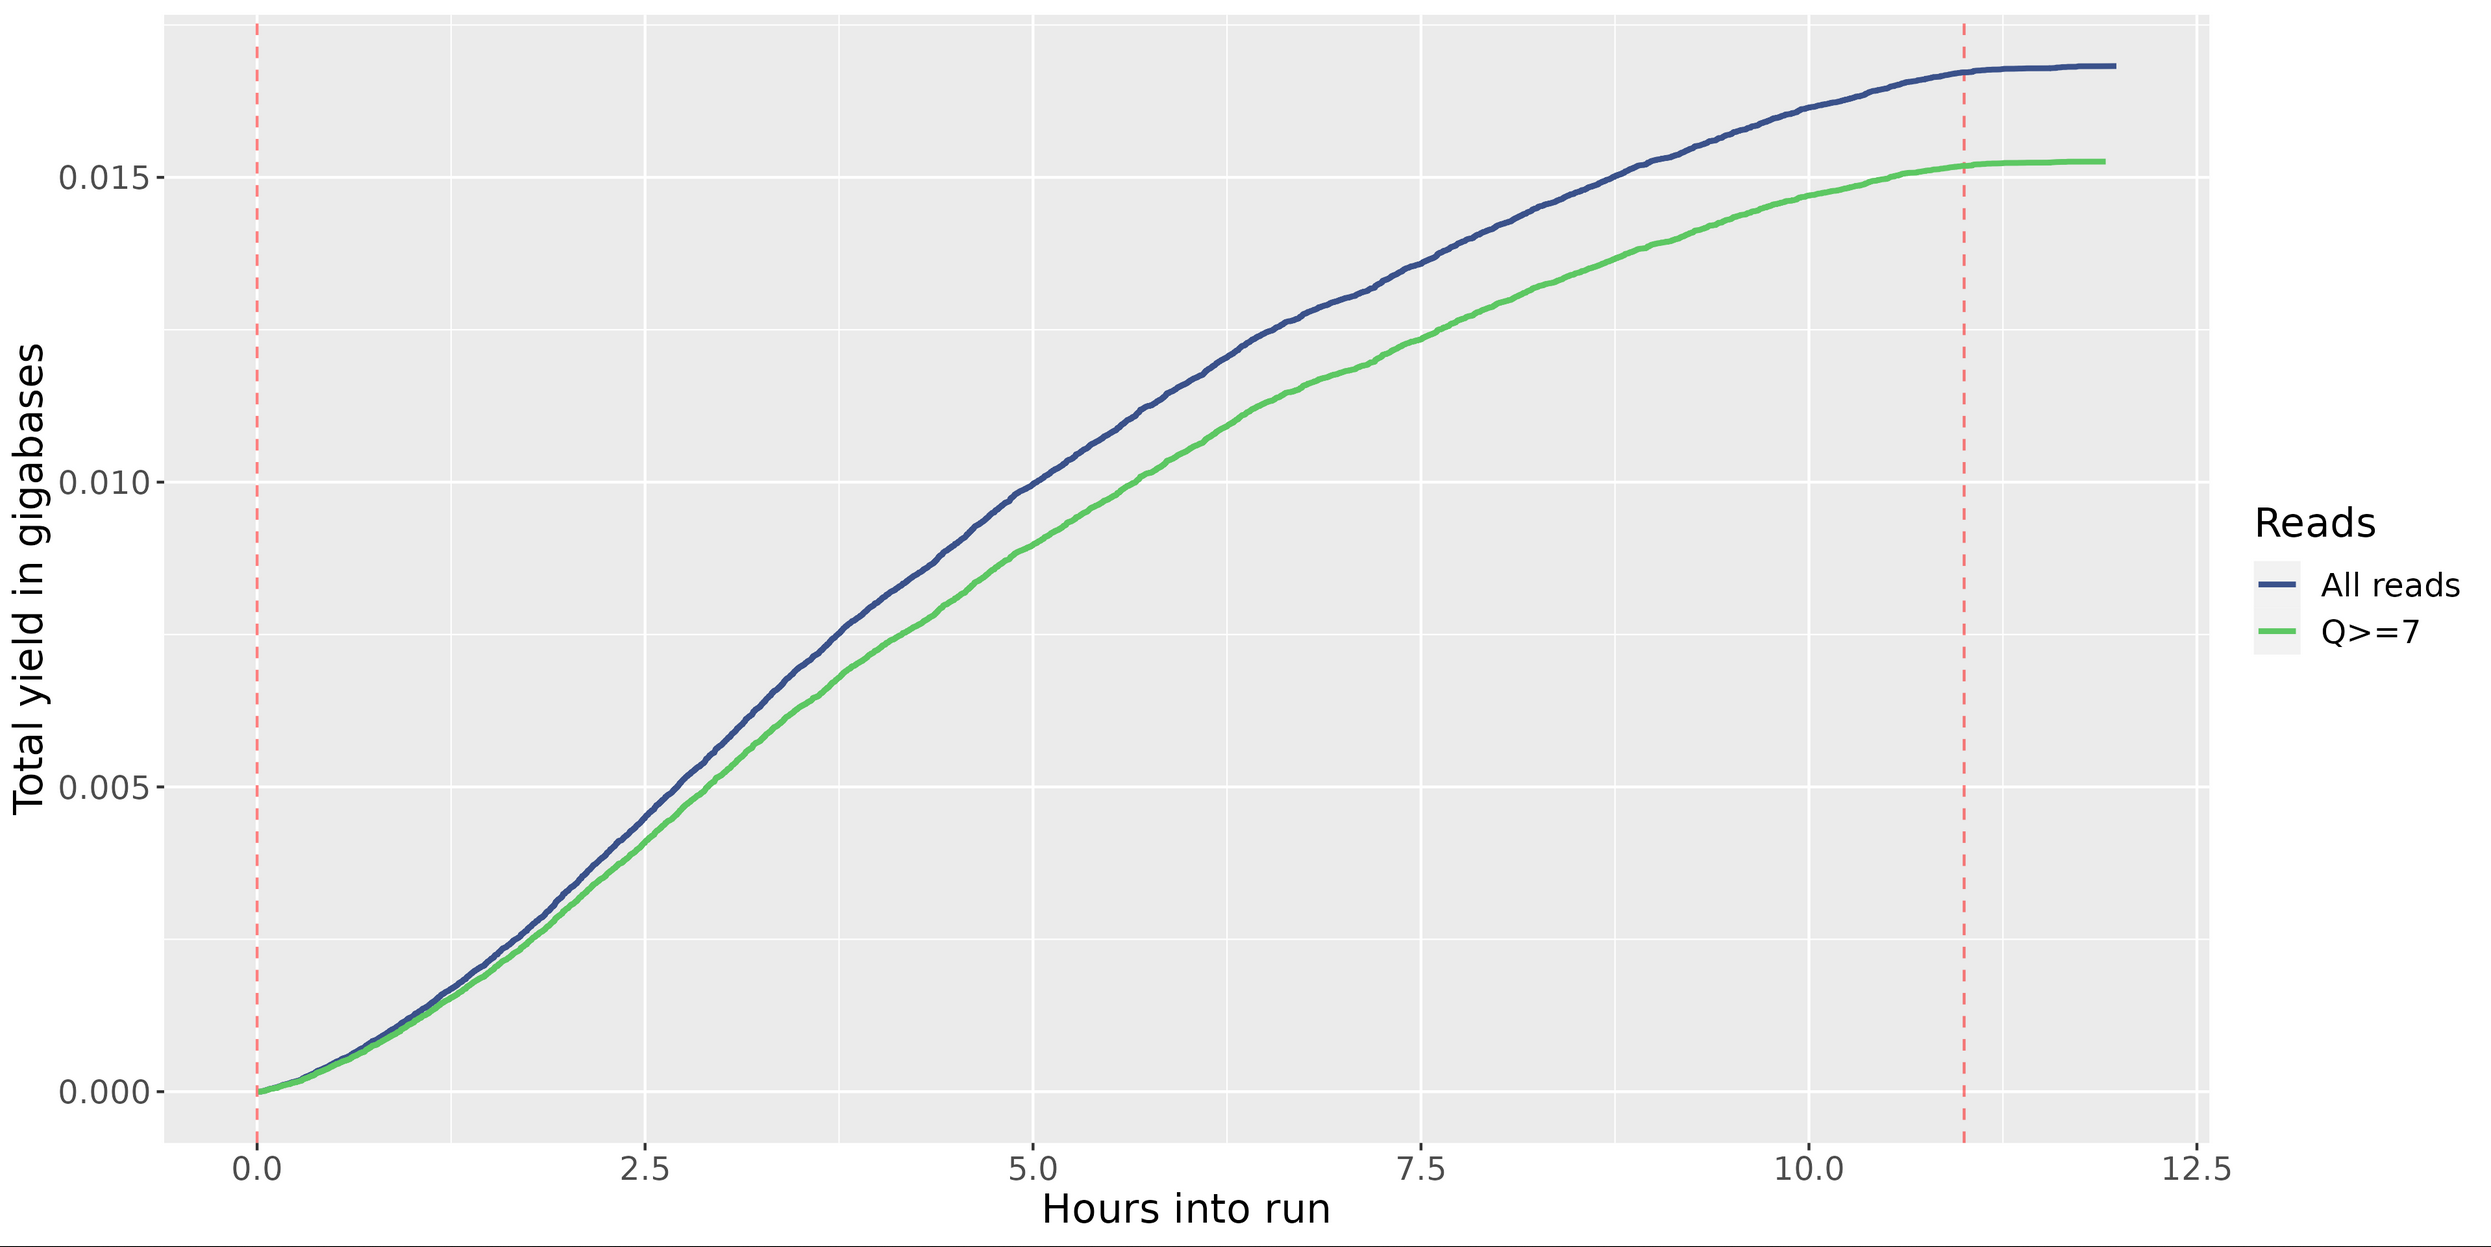
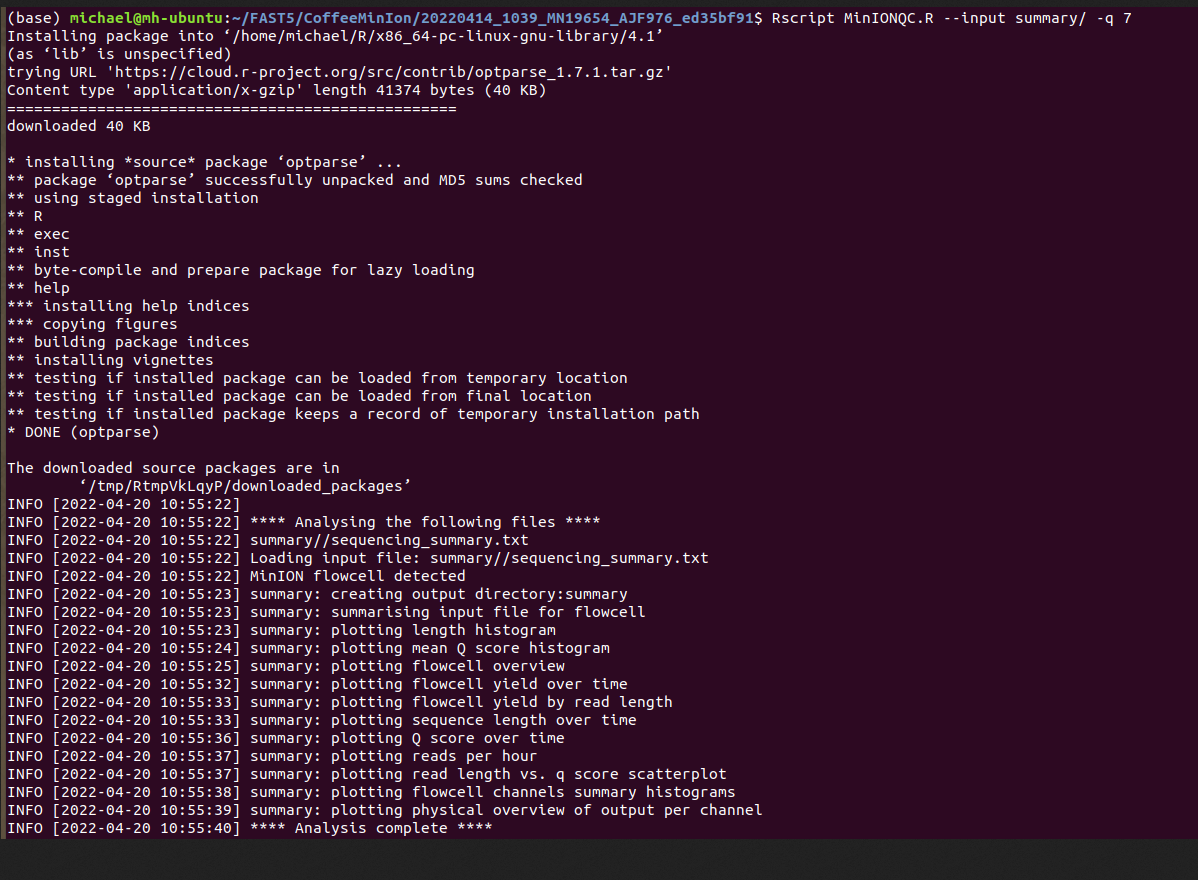
MinIONQC.R
First we want to reorgainze the data structure so the RScript from https://github.com/roblanf/minion_qc can plot,interpret and analyze the MinION reads. Create a summary directory and place final_summary.txt and sequencing_summary.txt. Copy the MinIONQC.R Script into main directory and run the following command line. It will produce a standard output if successful
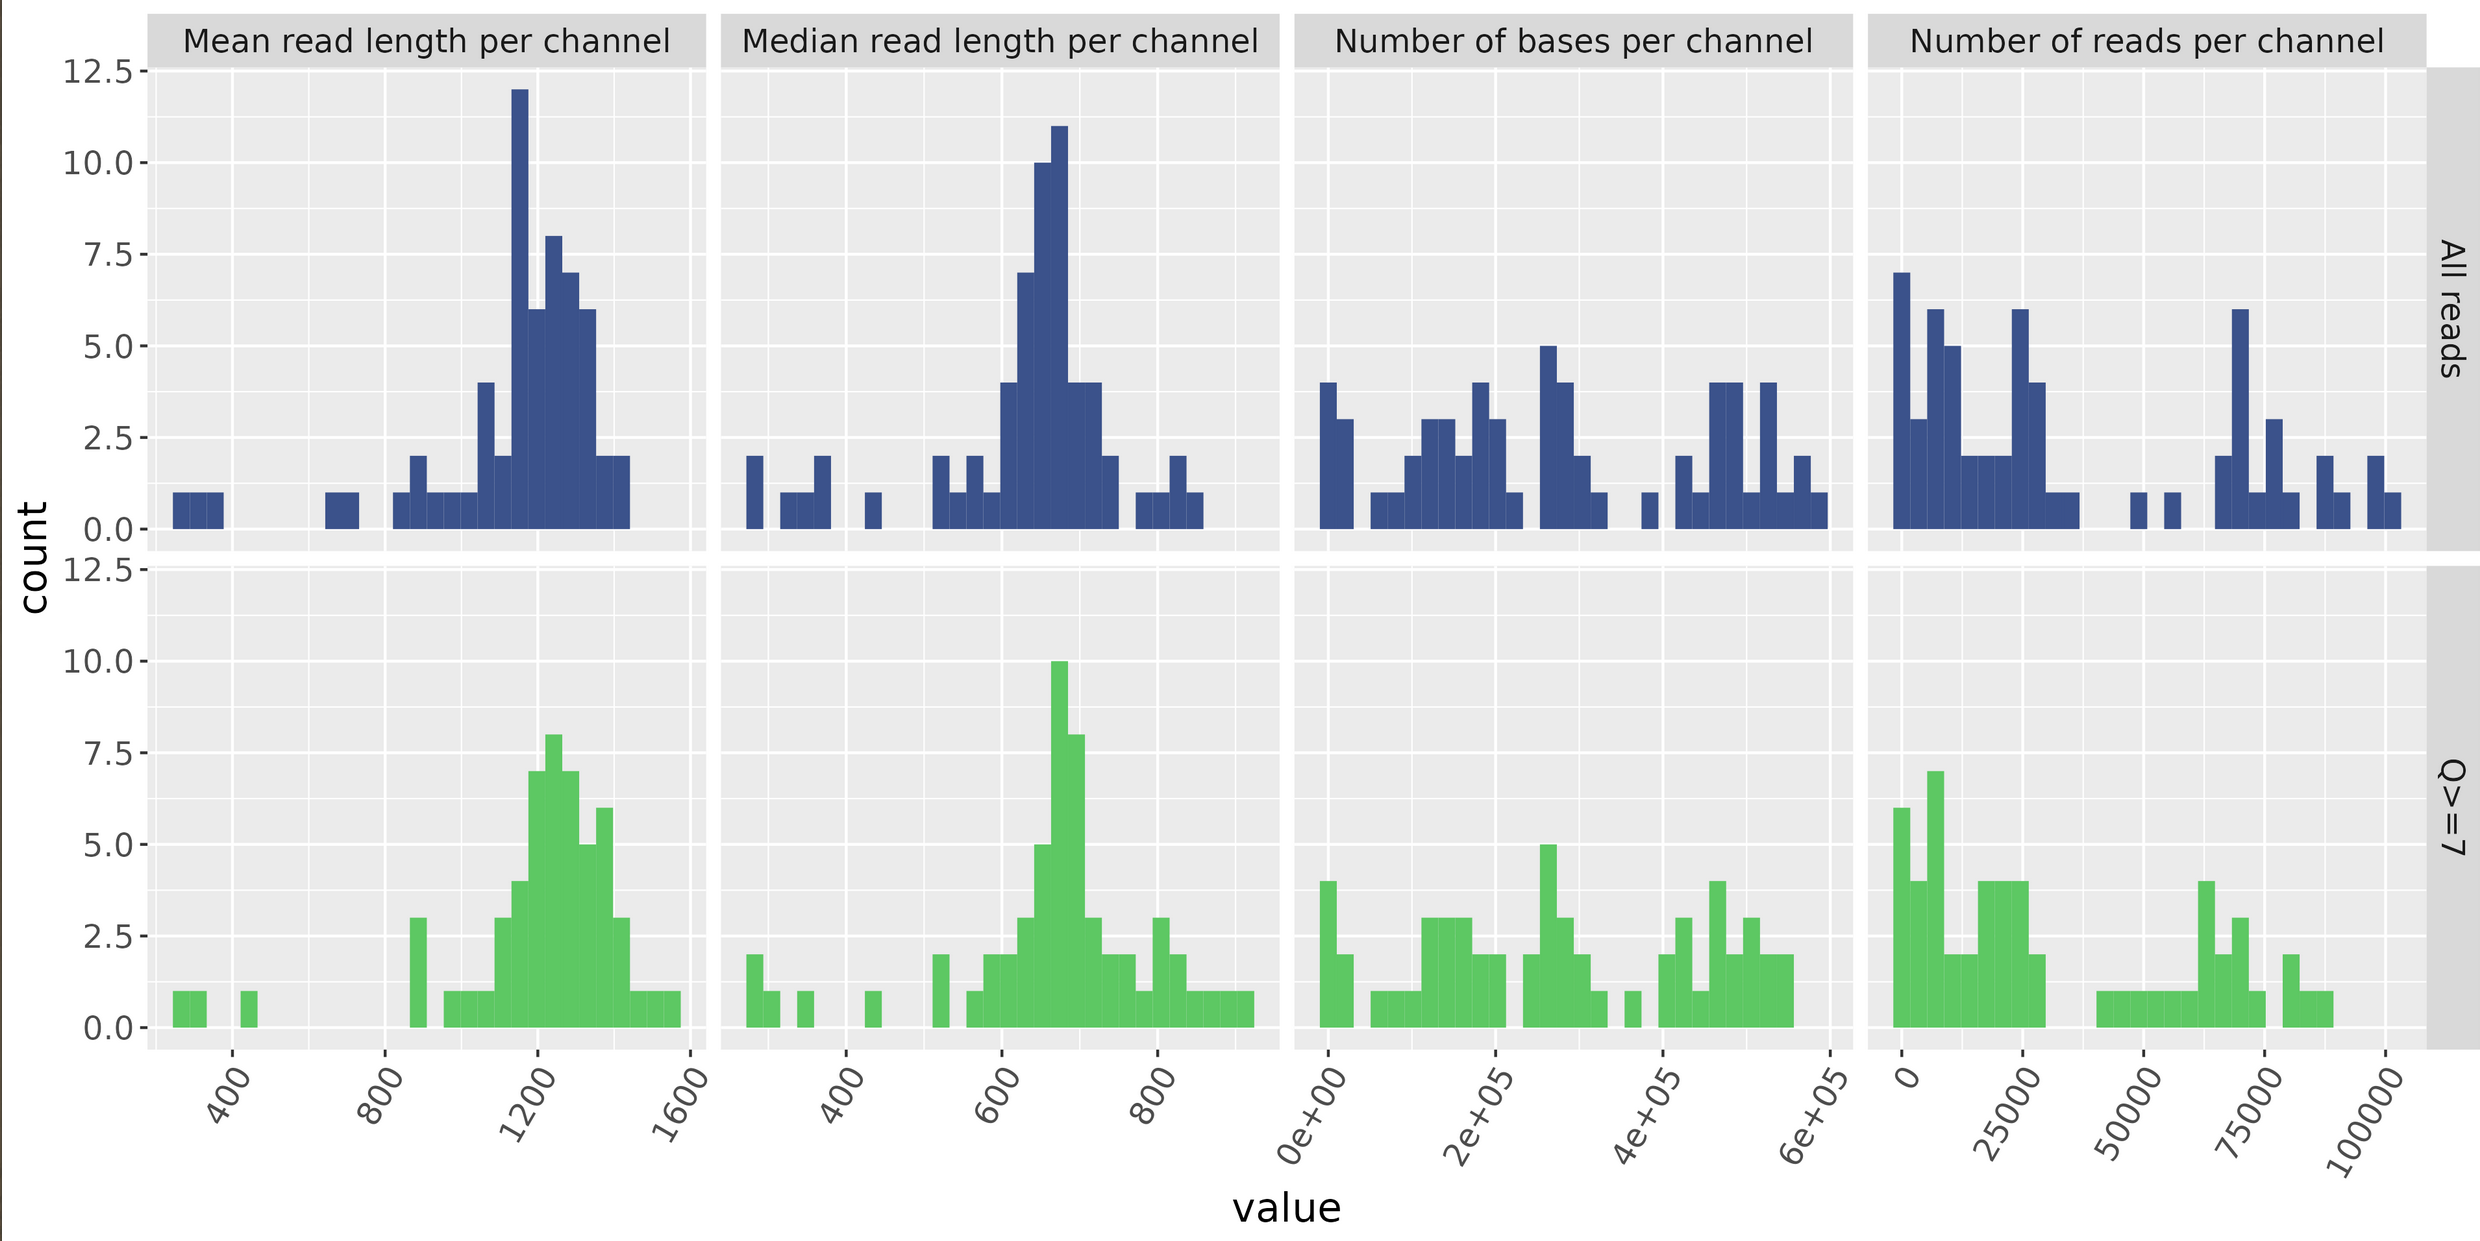
Channel Summary
Flowcell Overview
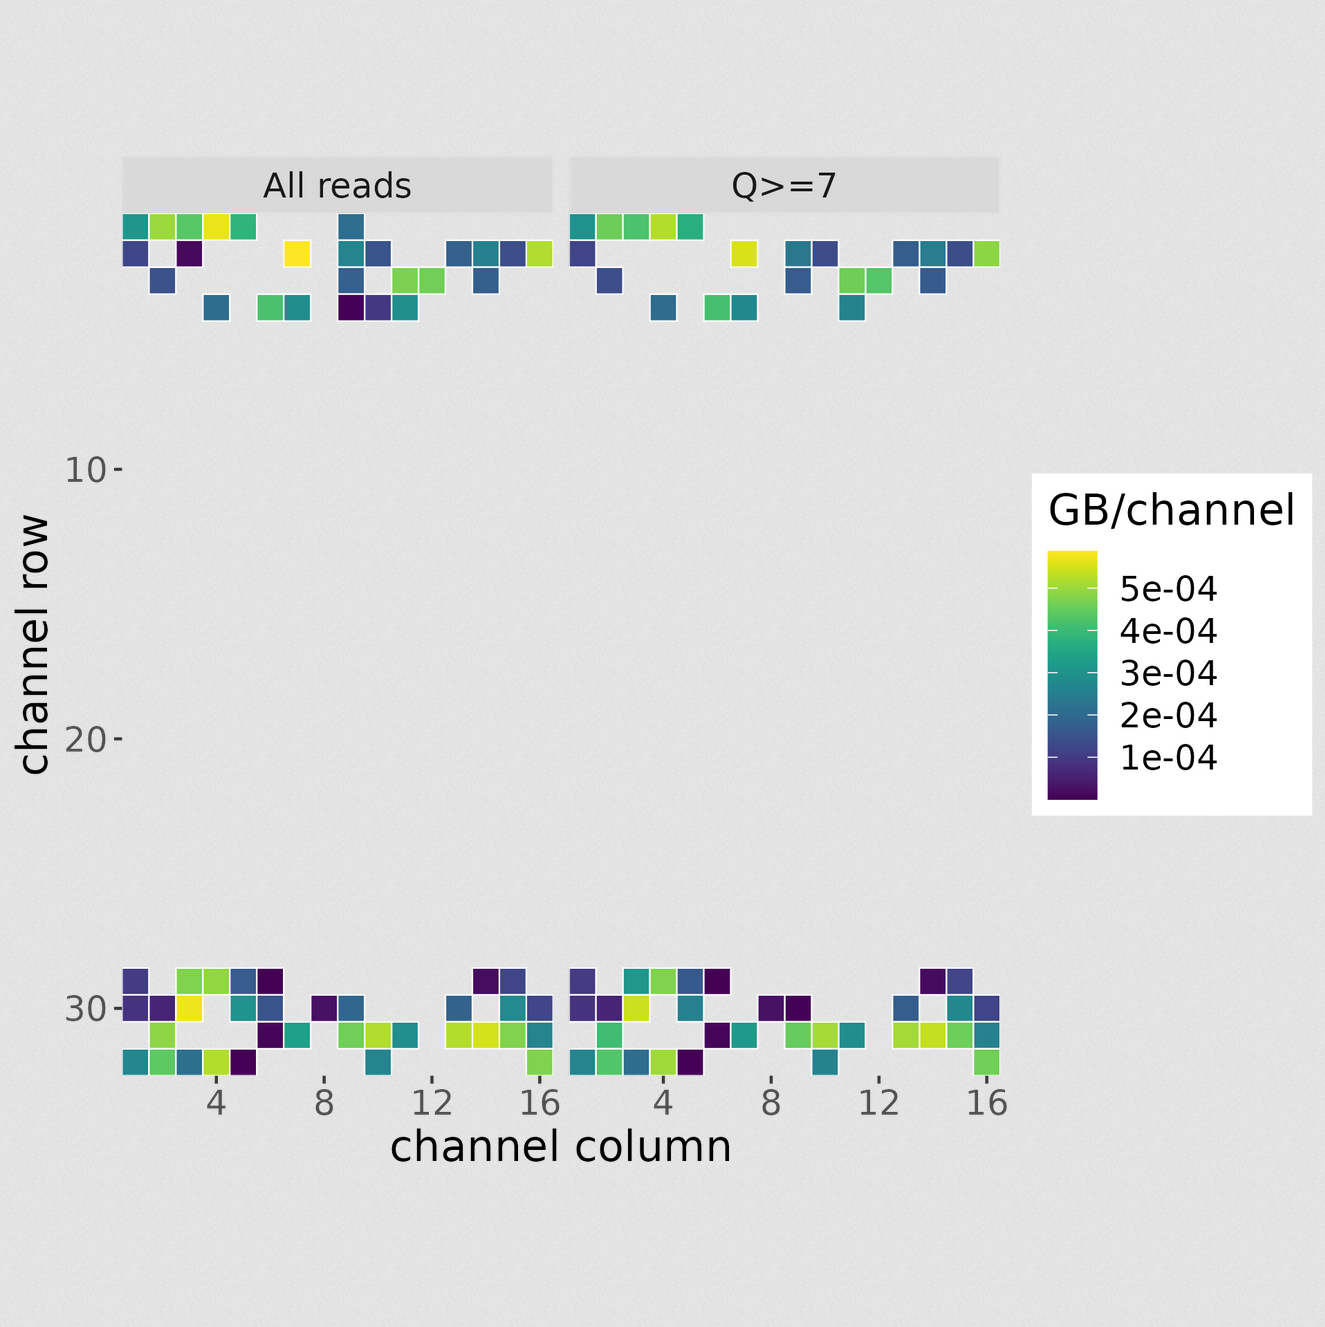
GB Per Channel Overview
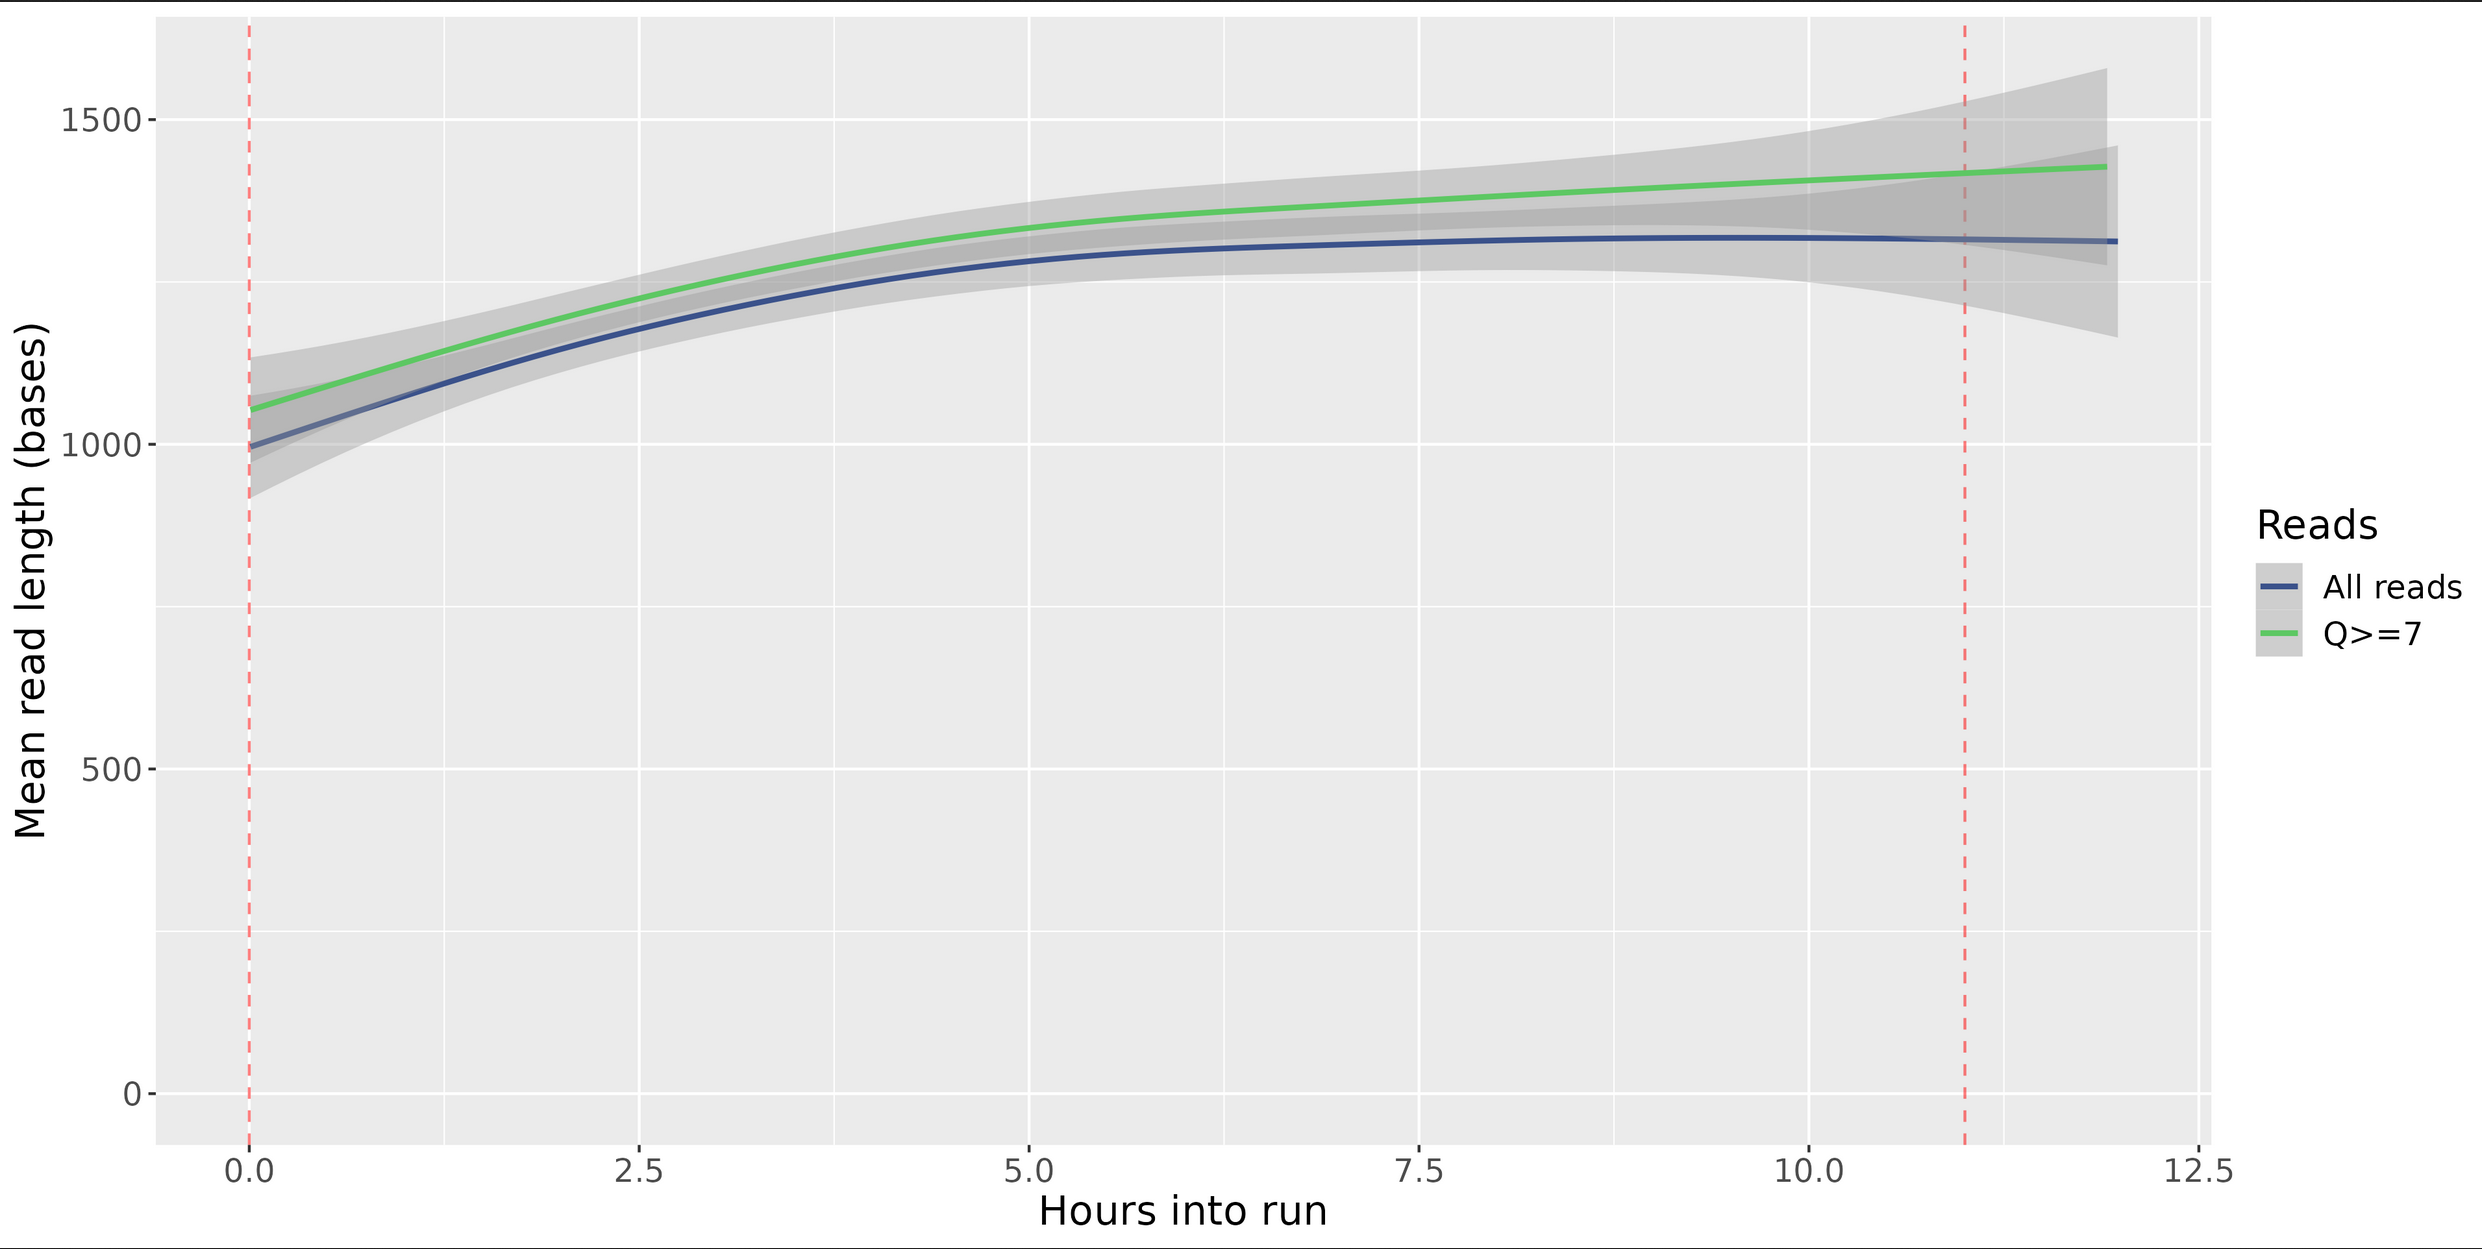
Length Per Hour
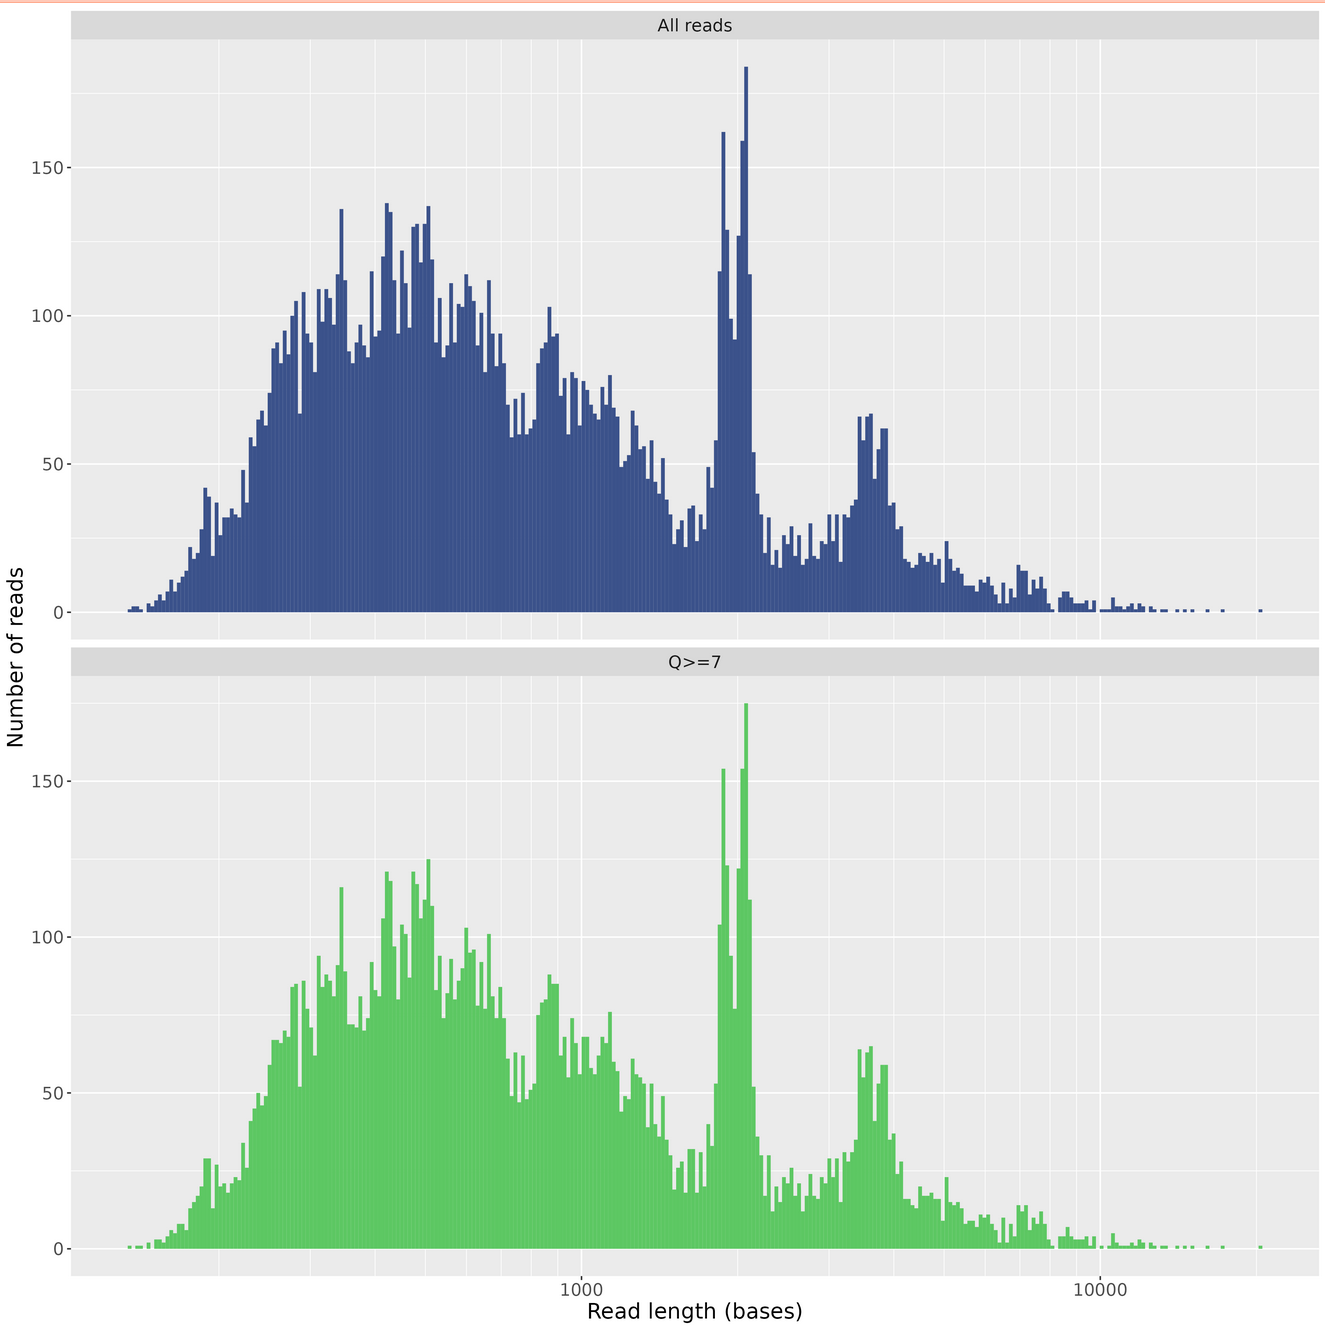
Length Histogram
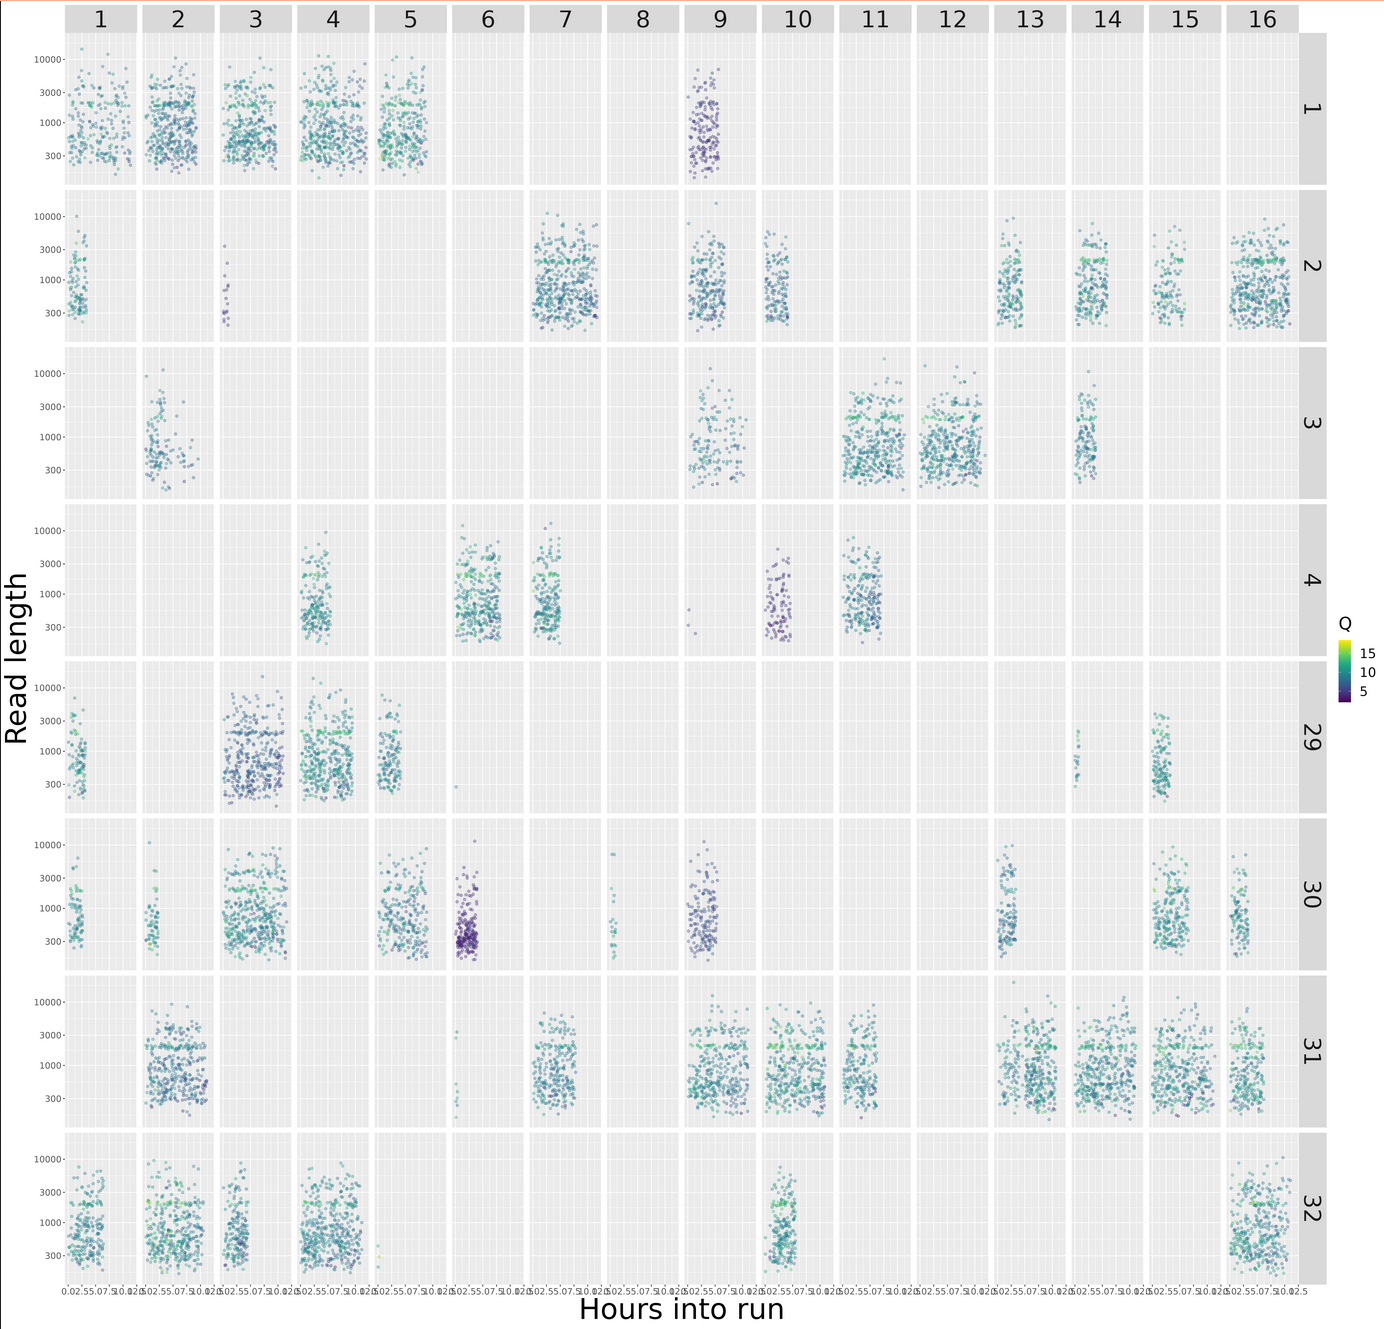
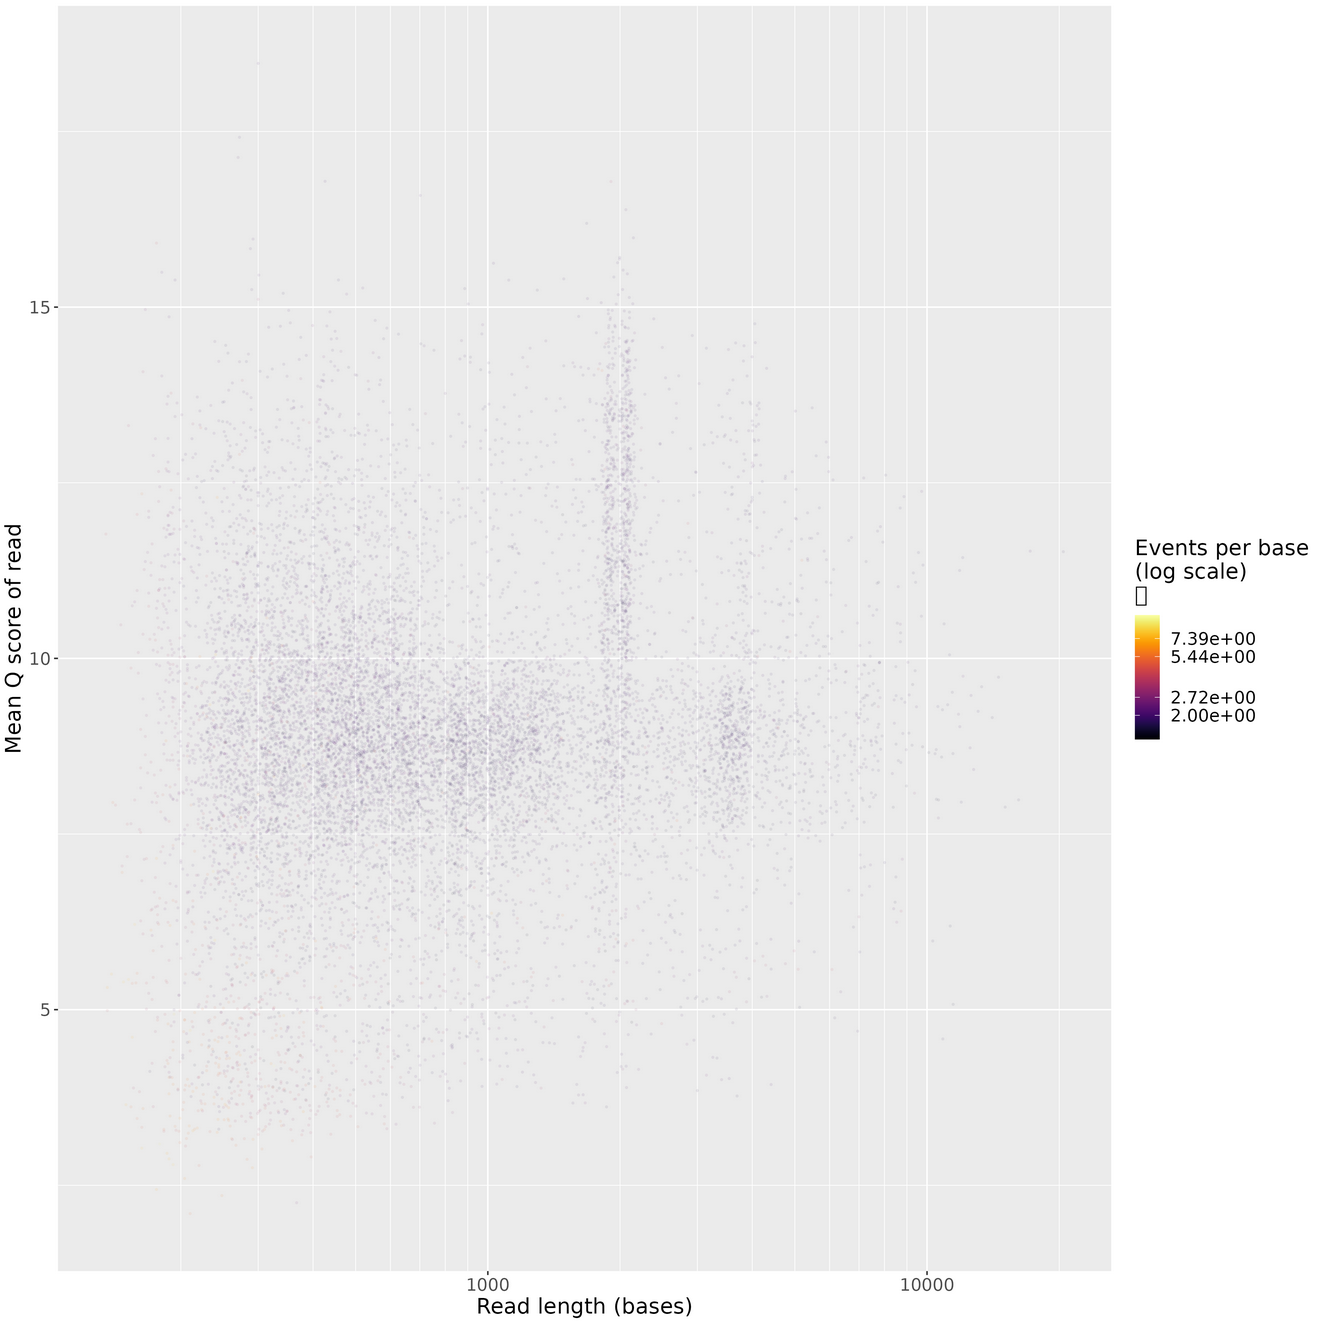
Length vs. Quality
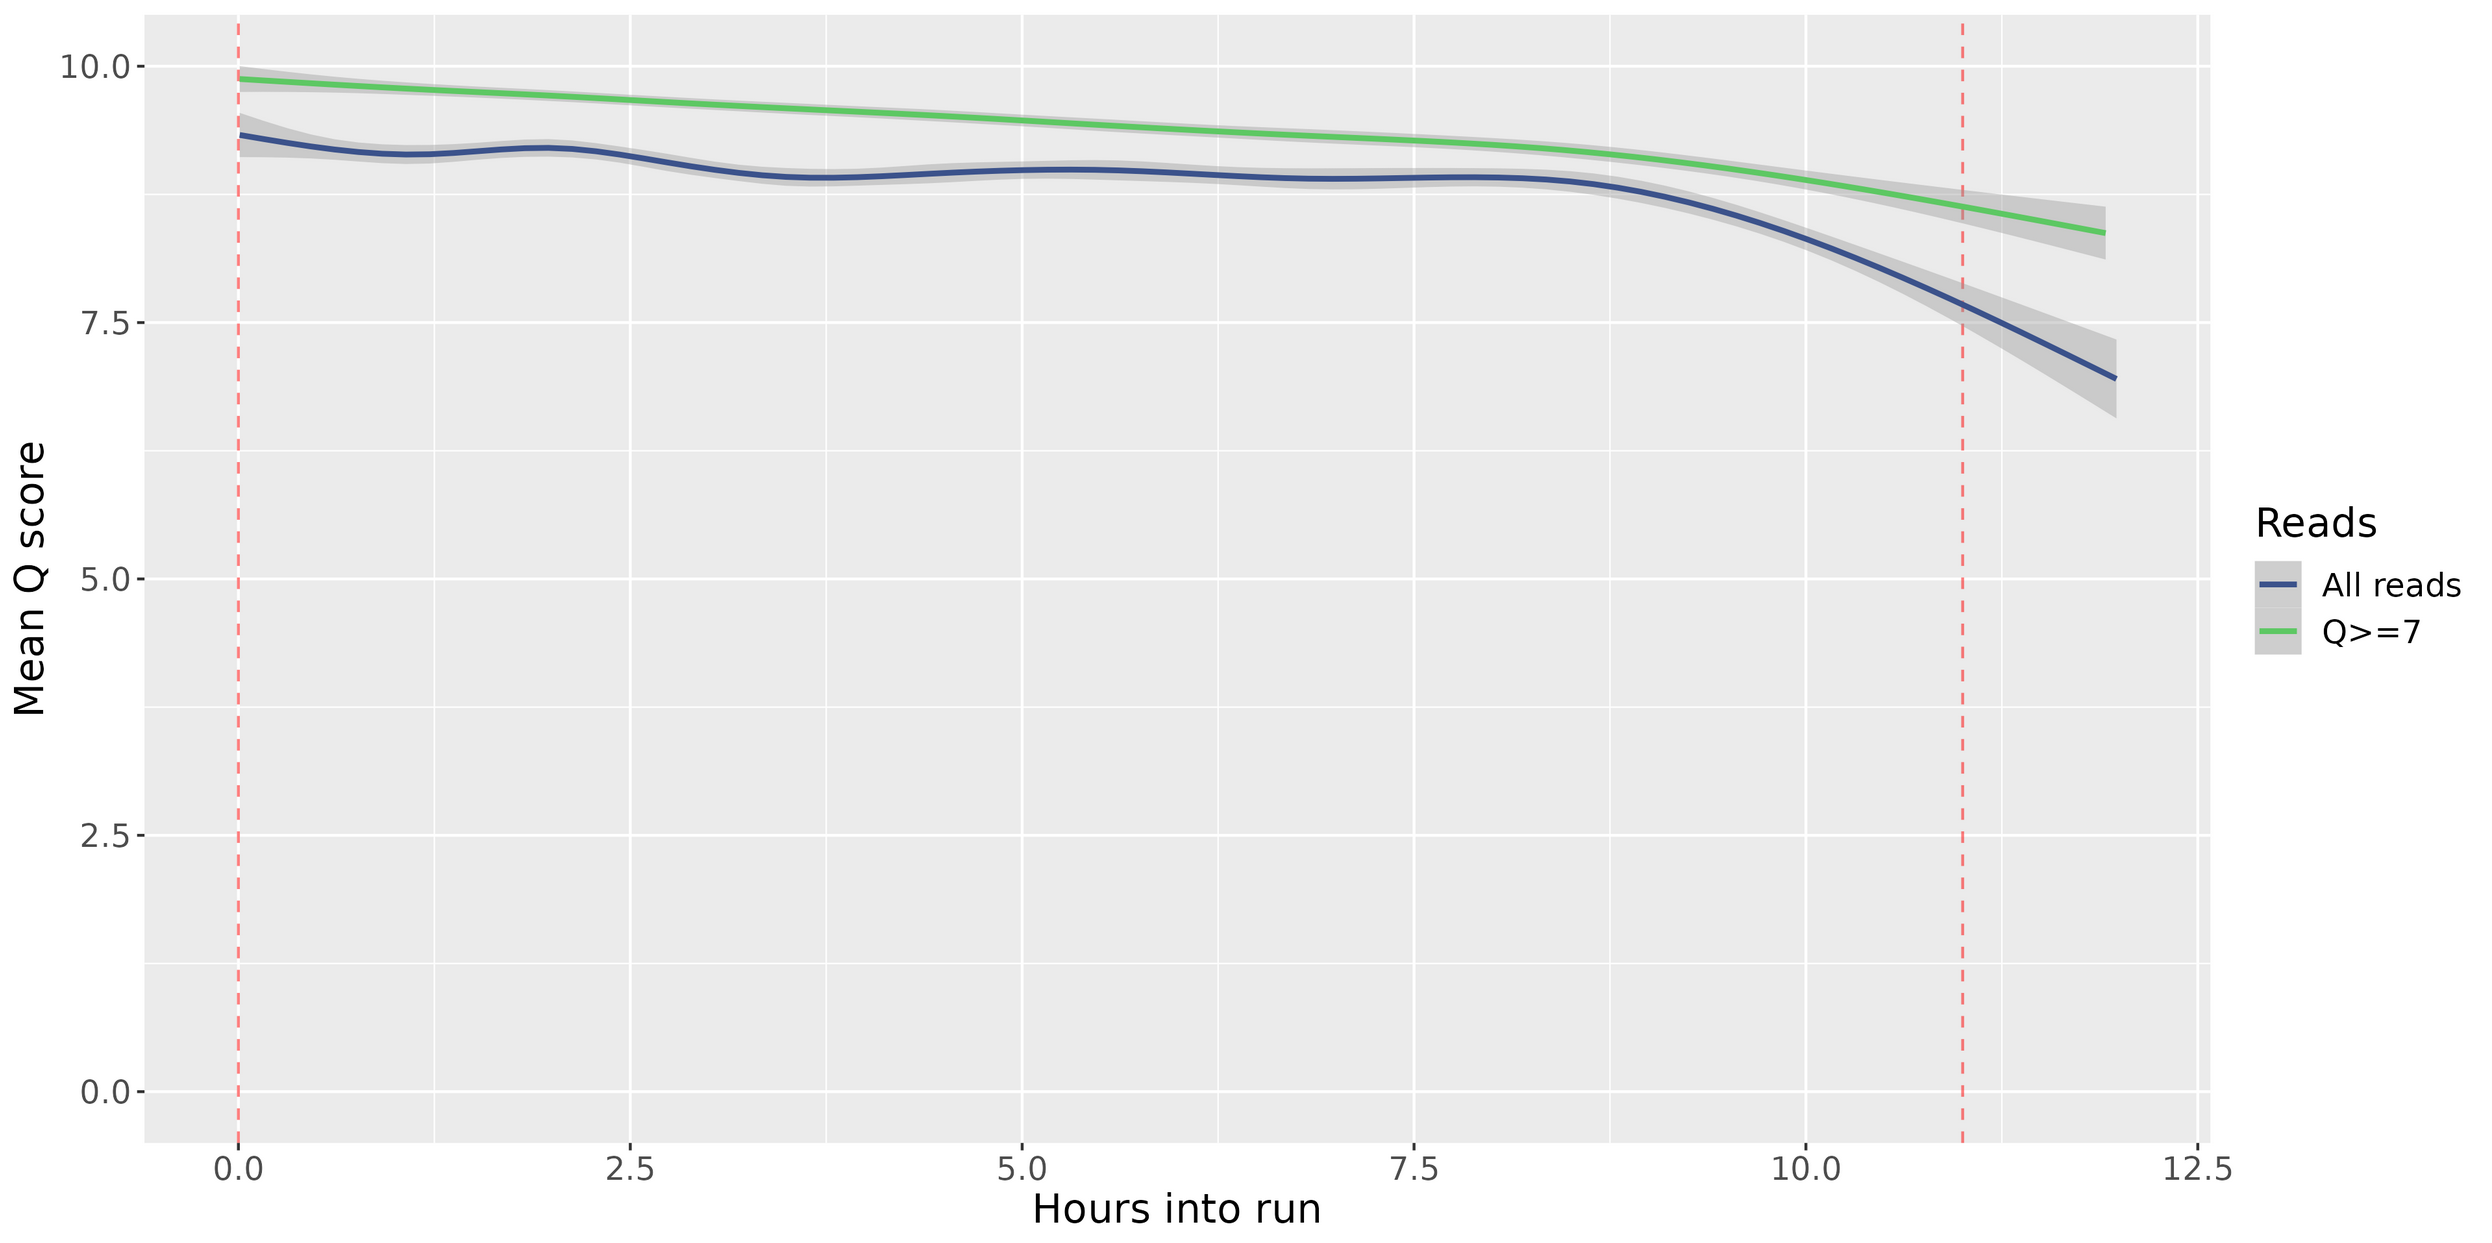
Quality by Hour
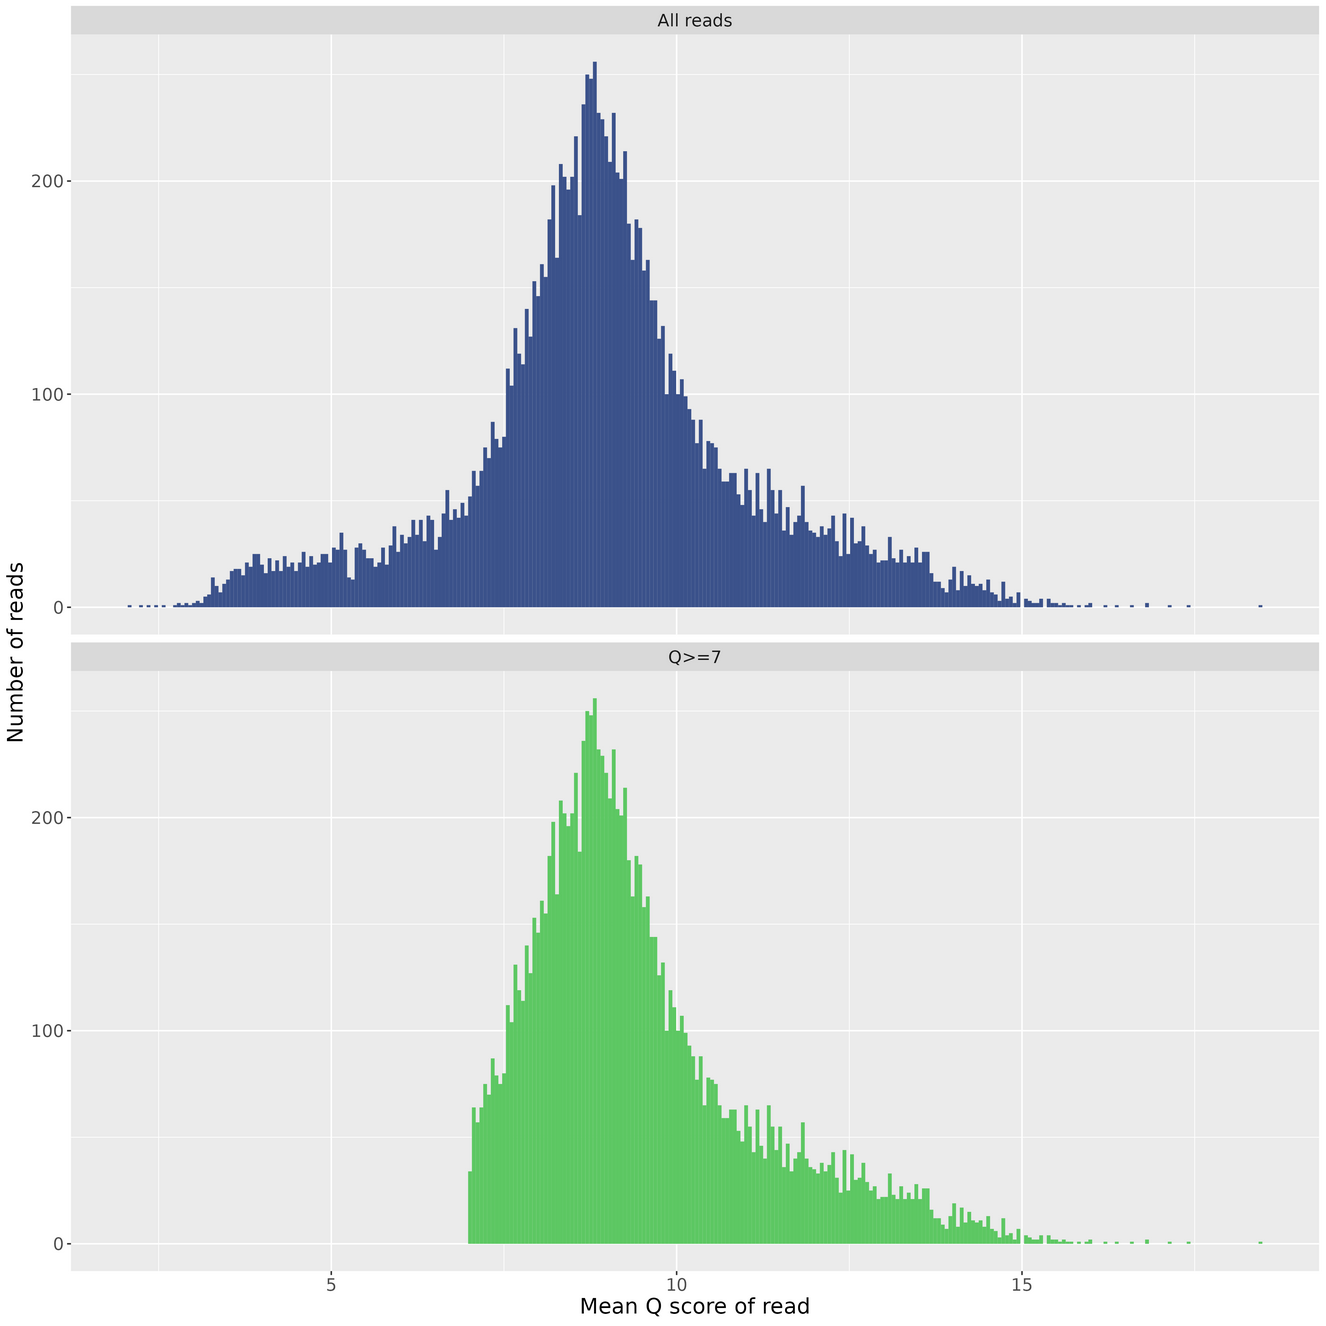
Quality Histogram
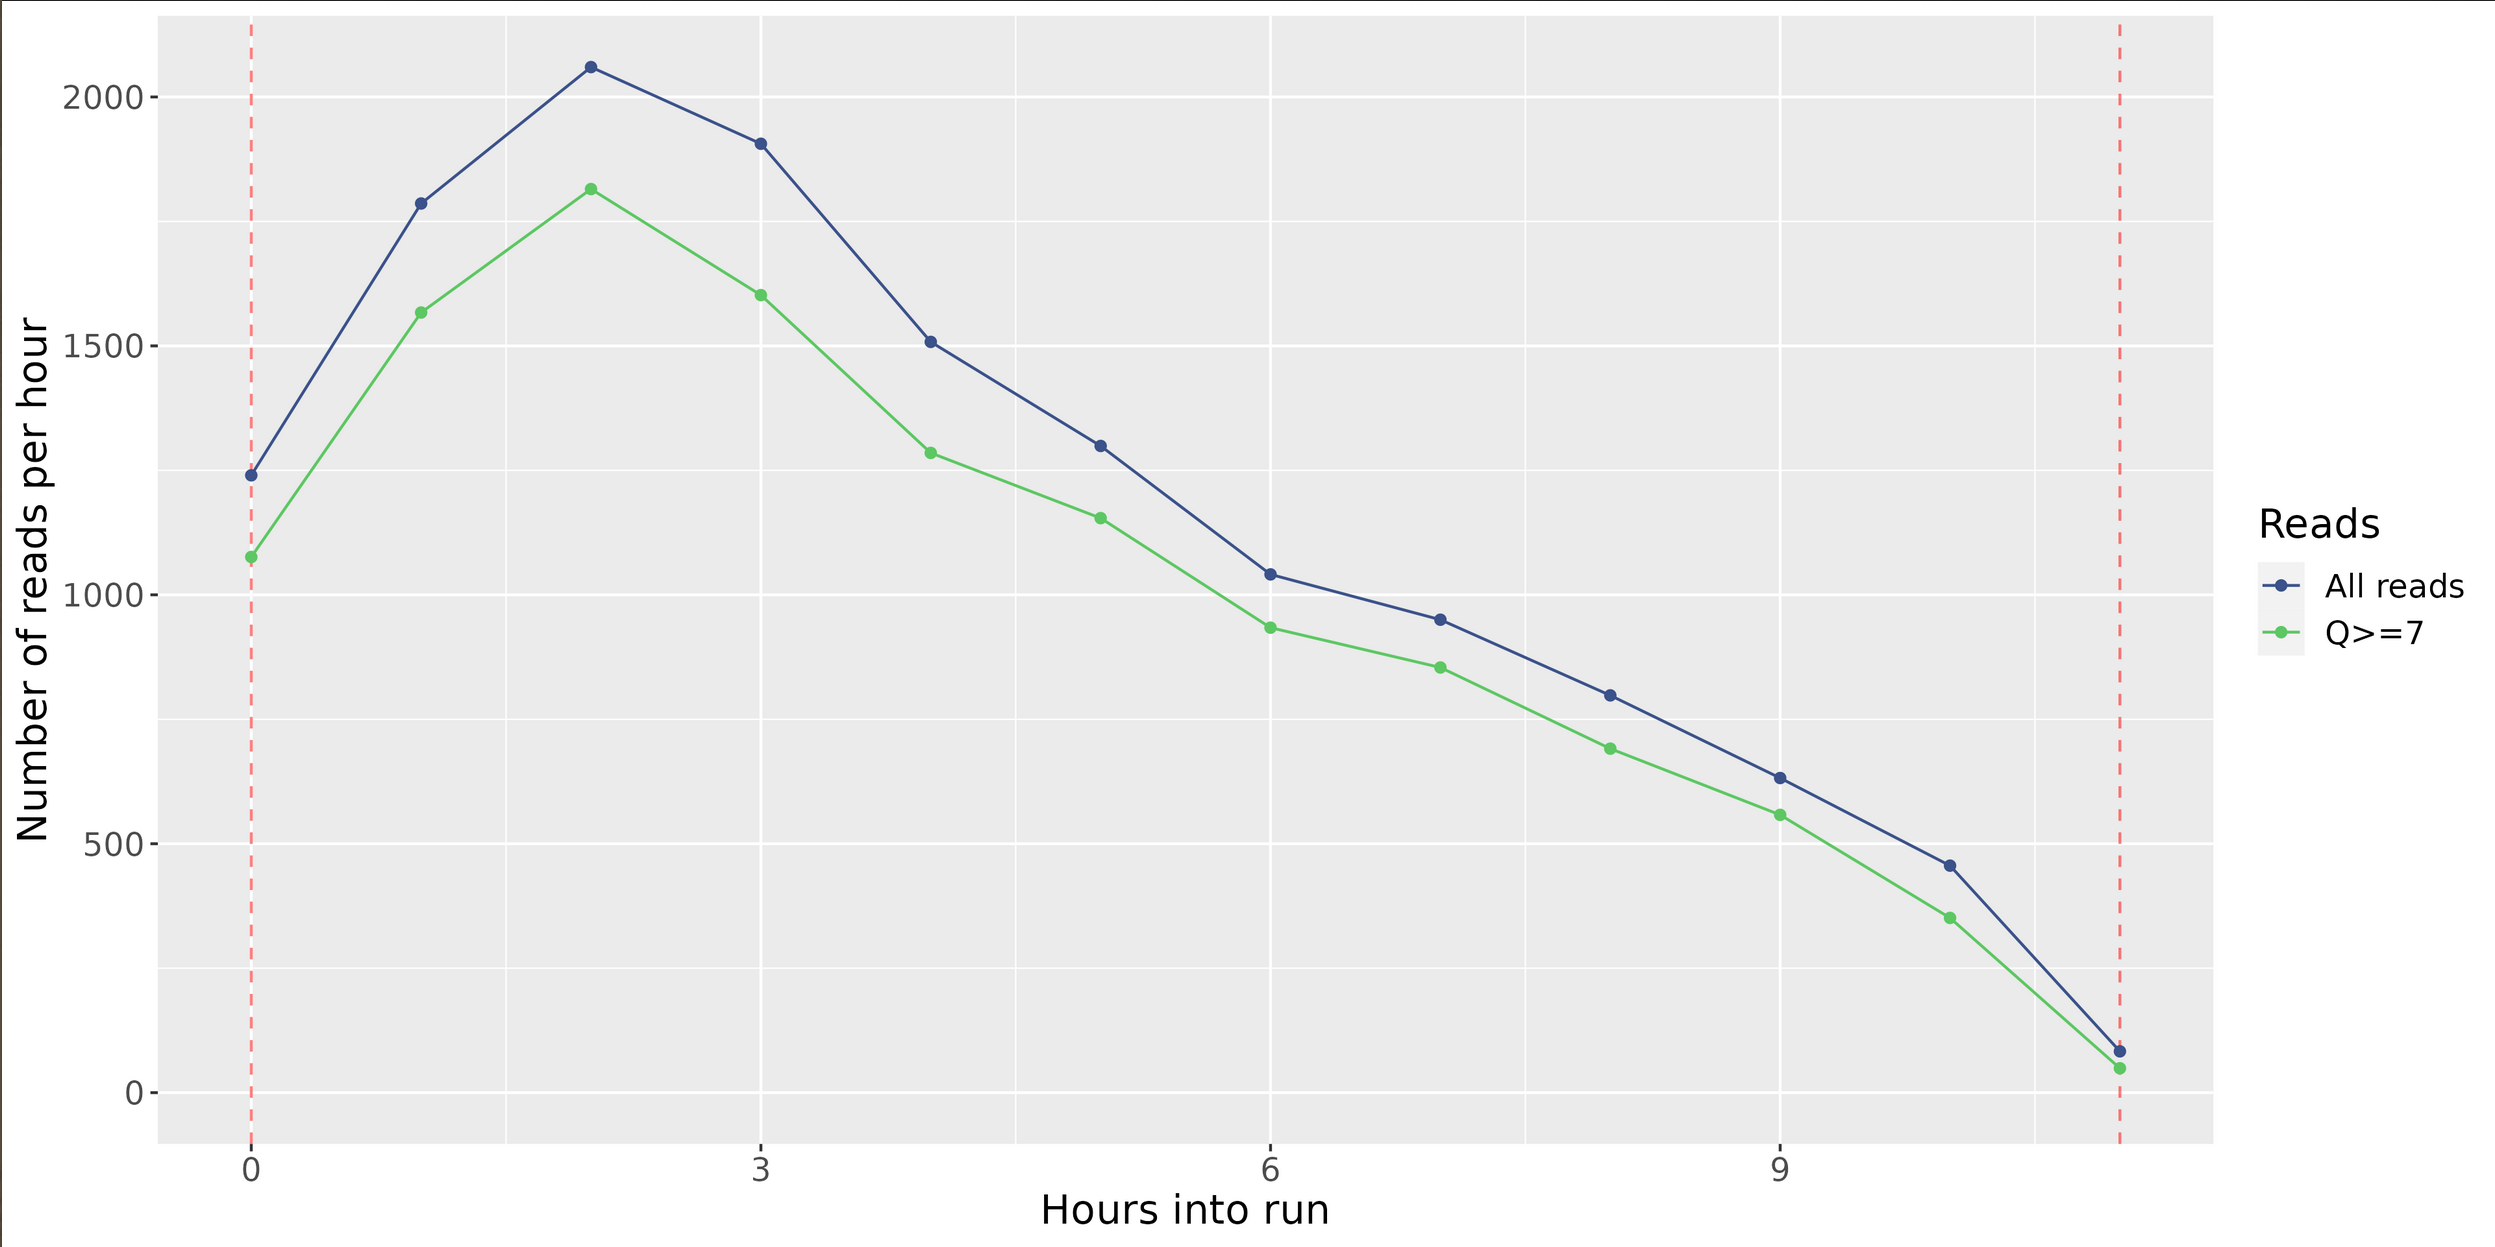
Reads Per Hour
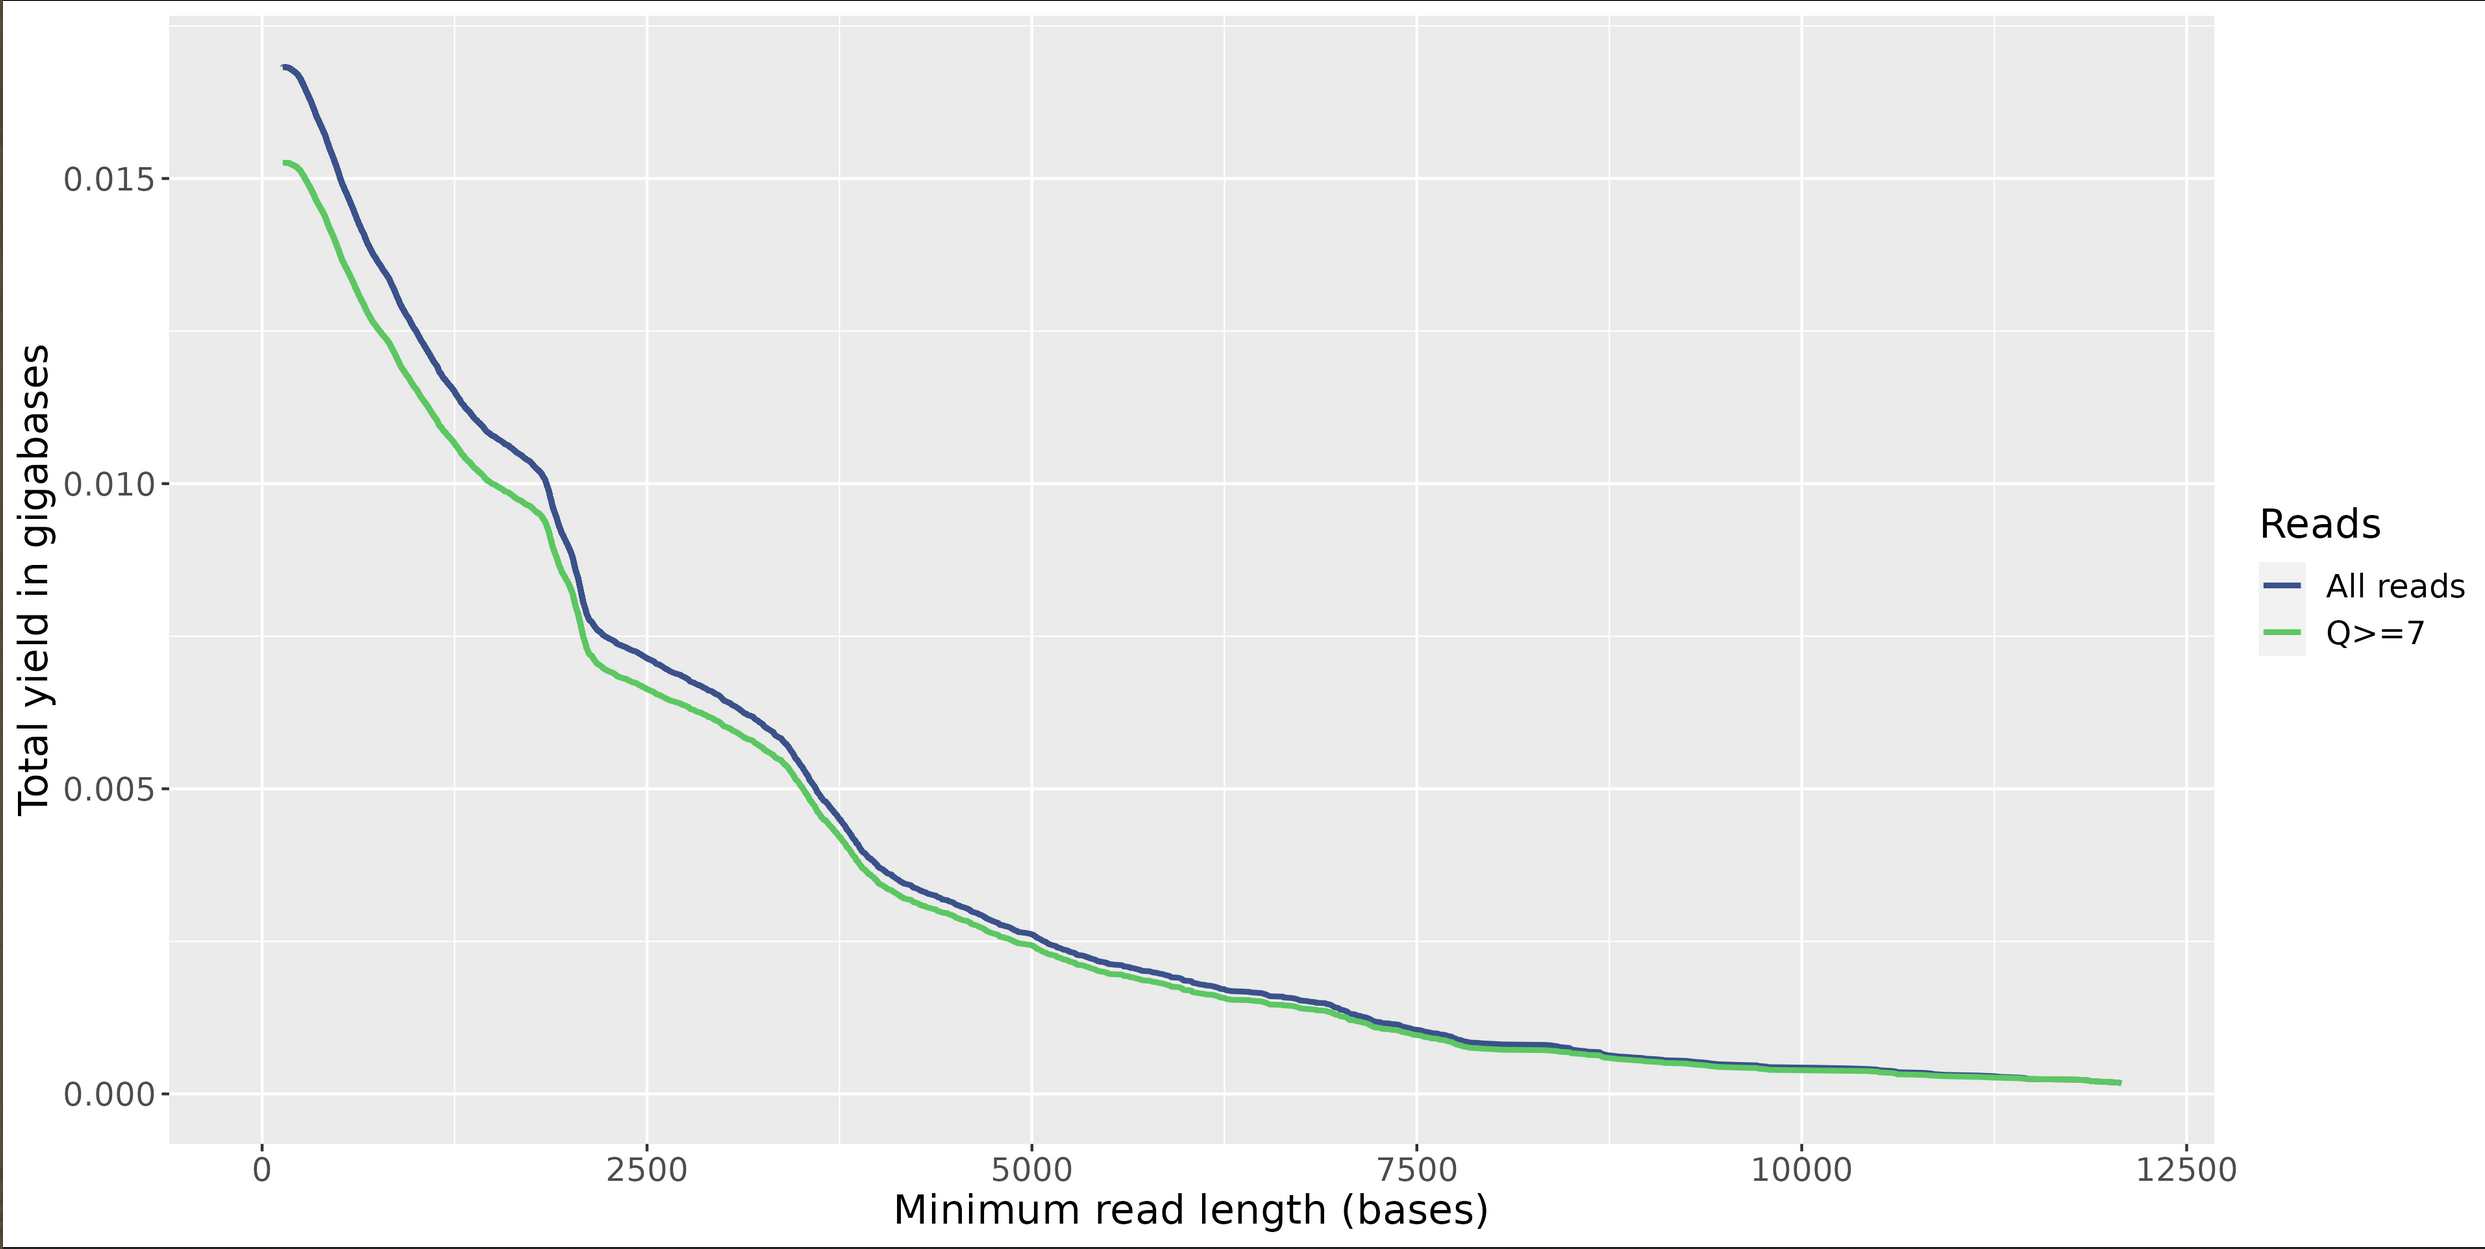
Yield by Length
Yield Over Time